Trader333
Moderator
- Messages
- 8,766
- Likes
- 1,030
I guess you think the market is oversold - hope you're wrong
Not on this one I wasn't.
Paul
I guess you think the market is oversold - hope you're wrong
Nice one Paul. Interesting too, in that I didn't realise you are a scalper.Not on this one I wasn't.
You can normally find trades like these most days and I find it much simpler to see and read what is going on from the chart and level 2 rather than to use lots of dubious indicators.
Works for me and has done for years.
Richard
Hello thevinman,
Sometimes the spread can be wider than 1c or 2c, but you can always buy on the bid and sell on the ask to capture part of the spread for yourself.
Also with momentum stocks the momo usually carries you into profit very quickly, provided your timing is right. You really need to be experienced to trade within the spread with momo.
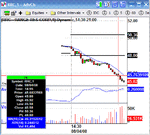
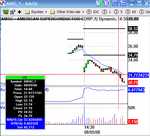
It doesn't matter too much what the average volume is; what really is significant is how much it is trading on the day itself.
Look at the attached image.
The spread is tight at the moment but there is no longer much trading, and the volume is not 1 million, it's 2.76 million.
Hope that helps,
Richard
You can normally find trades like these most days and I find it much simpler to see and read what is going on from the chart and level 2 rather than to use lots of dubious indicators.
Hi Vineman,So today I changed my scanner to 2 day high and 2 day low, priced between 7 and 70 dollars with an average volume of a 1mln.
If you have any suggestions let me know.
Hi Pete
So I take it your looking for a breakout of the 2 day high/low? Be careful of this set up as this strategy is well known and does produce many fakes.
My min volume filter is on >0.5m and I trade anything price wise but thats whats suits me.
Regards
PB
Hi Vineman,
You don't mention how many stocks this set up produces each day but, if it's a lot and you want to refine the list further, you could try adding a a filter to select only those stocks with a daily H/L trading range of >$1.00. I set mine to >$1.50 and, additionally, the volume threshold for NYSE stocks is 4 million (and 1 million for Nasdaq) which helps to produce a more equal balance between the two exchanges.
Tim.
Dubious indicators work for me very well indeed Richard and I wouldn't do without 1 or 2 of the more useful ones.
Level 2 has never done it for me and I have always found it to be over-rated....fleeting and deceiving.
But each to his own eh ?
I completely agree with Richard - then again - I usually do! ATR is an excellent tool to help ensure your position size is within your risk parameters. It would be tricky, I imagine, for eSignal to encompass ATR as a filter to scan stocks, not least because the readings will vary according to the timeframe chosen. Once you have your scan results, you could try varying the timeframe until ATR is at an optimum level for your risk/ money management strategy. High priced and volatile stocks that have an ATR reading that's off the Richter scale on, say, a 10 min' timeframe, may have an acceptable reading on a 3 min' or a 1 min' timeframe. I realise that this approach many not be compatible with your strategy and that many traders prefer to stick to set timeframes and not to mix 'n' match! Just thought I'd throw it into the melting pot!Unfortunately esignal power scanners only have price and volume filters. I have suggested to esignal a ATR filter and a relative volume filter, but they haven't made any changes in the scanners for years. So I will do with what I got! 😀