Elliott Wave EUR/USD

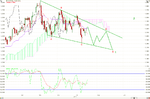
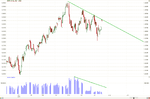
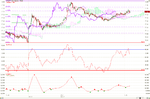
I'm having trouble opening the screen with the charts. I tried to double click on the "cross" and also right click and "open picture" but nothing worked. Any suggestions?
Thanks

I just checked from another computer and the charts loaded fine from here.
 
I have been having a little trouble figuring out what the Euro is up to lately, but now there are enough candles on the day charts to figure it out...............It has finished five waves down on a leading diagonal and now it is in the process of making three waves up for the correction............After the top of the retracement then it should accelerate to the downside............
 

Attachments

  • EUR_USD_07_17_Day.png
    EUR_USD_07_17_Day.png
    51 KB · Views: 148
Here is the Aussie day chart...........I think there is a good possibility that the nominal high the Aussie made is the top............If not then it has to make a five wave move on the day chart............I don't think it has room to do that and it has made a five wave move on the 3 hour chart , so it has to at least have a good correction from here...............
 

Attachments

  • 07_17_2011_Day.png
    07_17_2011_Day.png
    43.8 KB · Views: 129
The USD_JPY. As much as I want the dollar yen to go up long term, it looks like it will make one more low on the day charts, but will make another high on the hour charts..................This will be the last bottom on the day charts for years to come...............This is only a wave 4 correction on the day charts..............But it will be a good long this week.................
 

Attachments

  • USD_JPY_07_17_Day.png
    USD_JPY_07_17_Day.png
    50 KB · Views: 137
  • USD_JPY_07_17_hour.png
    USD_JPY_07_17_hour.png
    46.8 KB · Views: 126
The .7800 which is the .8540 fibo is a good target for a long term reversal.................(Whew,,,,,,,,,I wish this didn't take so long to play out).................
 
Nice work!

If your right about the yen we could see some good pips coming our way once it reaches .78
:clap: I have a lecture at 11 but I will give you a call at around 12 my time :)
 
This has always been my favourite journal on T2W as you put lots of effort in to it..

And you never hesitate to help others that ask :)
 
USD_CHF update. If this does not go down below the .8142, then it looks like new highs for now for this pair. I am still up in the air about this pair long term. According to Elliott Wave Theory then this pair should have gone down below .8080 and it didn't break that. It came close but didn't make it. The only acceptable EW scenario that would allow for this not making a new low would be a truncated fifth wave. The verdict is out right now and we will just have to wait and see what happens.
 

Attachments

  • USD_CHF_07_17_2011_3_Hour.png
    USD_CHF_07_17_2011_3_Hour.png
    43.5 KB · Views: 141
Kiwi Update. This pair had one initial move down yesterday and then went into consolidation.......I cashed out my short at the Ichimoku cloud for +18 pips, but now it still has not garnered much momentum to the upside and this looks like the last leg of a corrective wave up rather than an impulsive wave up. I am selling here to look for another push down. The only thing here that does not look good to me is the stochastic and fractal under the candles is showing a buy signal.......but I do use that in conjunction with Ichimoku and Elliott Wave Counts and the Elliott Wave looks corrective. so that is why I am selling here........I am also posting a five minute chart which shows a sell on the stochastic and has a full 3 wave count...
 

Attachments

  • NZD_USD_07_18_2011_Hour_2.png
    NZD_USD_07_18_2011_Hour_2.png
    43 KB · Views: 137
  • NZD_USD_07_18_2011_5_Minute.png
    NZD_USD_07_18_2011_5_Minute.png
    48.6 KB · Views: 135
As the thread says, here is my EUR_USD charts and forecast. These are all daily charts tonight because the hourly is not doing much. The two ways that it can go is up to 1.4350 and then go down, or drop from here to the 1.3750 level. I am leaning to the short scenario, but I usually am because I know how things actually are compared to what the news tells us...............The Euro has been going up, but the volume is extremely low.........And the percentage channel has hit the median line.........The fibo arc is sitting on resistance...................and the pitchfork is on the upper channel line............These are all good indicators that say the EUR is going down..........The only indicator that is calling for more up from the Euro is the daily stochastic.............
 

Attachments

  • EUR_USD_07_21_Day_Volume.png
    EUR_USD_07_21_Day_Volume.png
    39.6 KB · Views: 145
  • EUR_USD_07_21_Day_Ichimoku.png
    EUR_USD_07_21_Day_Ichimoku.png
    50.2 KB · Views: 150
  • EUR_USD_07_21_Day_Fork.png
    EUR_USD_07_21_Day_Fork.png
    35.8 KB · Views: 145
  • EUR_USD_07_21_Day_Fibo.png
    EUR_USD_07_21_Day_Fibo.png
    52.3 KB · Views: 149
  • EUR_USD_07_21_Day_Channel.png
    EUR_USD_07_21_Day_Channel.png
    57 KB · Views: 146
Well the momentum won out today. I thought that on my EW diagonal count there would be more down before the upturn finished, but I was wrong. Anyway, let's move on from here. The volume on today's fast move up was still very weak on the daily chart. It hit resistance on the down trendline and now has reversed. The fibo chart is interesting because I measured the initial leg down and so far on the 3 bounces up, it has been very close to or hit the .76, .62, and now .50. All of these things lead me to believe that it is heading down now to the 1.37 area.

Good Trading,
JahDave
 

Attachments

  • EUR_USD_07_21_Day_Volume.png
    EUR_USD_07_21_Day_Volume.png
    37.2 KB · Views: 157
  • EUR_USD_07_21_Day_Ichimoku.png
    EUR_USD_07_21_Day_Ichimoku.png
    51.3 KB · Views: 149
  • EUR_USD_07_21_Day_Fibo.png
    EUR_USD_07_21_Day_Fibo.png
    25.8 KB · Views: 156
Here is the USD_JPY update. The hourly chart is definitely looking like an ending diagonal. I have been looking for a bottom for a while now........From an Elliott Wave Perspective the ending diagonal is a terminal move.........This means that it will go up for wave 4 and then get some underthrow for wave five.........After that this should be a long term reversal..........Also. the USD_CHF should be ending a 10 year down trend.........I thought it was going to end at the 1.32 area, but as usual I called it early........... It does not matter that much because the reversal will last for years.......
 

Attachments

  • USD_JPY_07_28_hour.png
    USD_JPY_07_28_hour.png
    43.5 KB · Views: 130
Here is the USD_JPY update. The hourly chart is definitely looking like an ending diagonal. I have been looking for a bottom for a while now........From an Elliott Wave Perspective the ending diagonal is a terminal move.........This means that it will go up for wave 4 and then get some underthrow for wave five.........After that this should be a long term reversal..........Also. the USD_CHF should be ending a 10 year down trend.........I thought it was going to end at the 1.32 area, but as usual I called it early........... It does not matter that much because the reversal will last for years.......

JahDave - I have the same thought about JPY. I am waiting for the opportunity to establish a long term position.
 
JahDave - I have the same thought about JPY. I am waiting for the opportunity to establish a long term position.

Thanks for the backup SnowRider. I told you a month ago that we would only get better as time goes by................I would think that there will be some throw under at about .76, or .7650.........There is almost always throw under or throw over, depending on which way the trend was running........After that then we should see some clear sailing up for a long time................(I might get out for a primary wave 2......LOL,,,,,,,,,Maybe I will even trade it down), but that is beside the point of a major reversal....
 
It is funny that the USD_CHF is making a totally different pattern from the YEN, but still the same............The USD_JPY is forming an ending diagonal.........The USD_CHF is forming an expanded flat...........both of theses patterns are bullish USD after more than a decade................
 
Thats what we love to hear :clap:

I'll be starting a journal of my own on monday i think, i'll email you in a bit

Please do let me know when you start your own thread Doom. I will definitely subscribe to it. I hope your trading is going well. On the previous topic........I think the long term reversal for the USD will happen this coming Thursday or so.:cool:
 
In my 6 years of trading currency I have never seen this pattern.......It may have happened while I was not looking, but I have not seen it............Anyway, on the USD_JPY 5 minute chart there is an ABC down and then apparently a Zig-zag forming back up.............Maybe i read this pattern wrong and it is an extended "C" wave back up...............I will post the chart and you can decide..........
 

Attachments

  • USD_JPY_07_31_5_Minute.png
    USD_JPY_07_31_5_Minute.png
    44.5 KB · Views: 142
Last edited:
Top