Dow Intraday Strategy - 10/20 pts target

dpfuller

Junior member
Messages
40
Likes
0
Morning all,

I've been playing around with various moving average strategies over the last few weeks with a view to developing a simple intraday strategy that will return 10-20 points on each trade. The DOW seems to be the obvious market given the large daily range and good volatility.

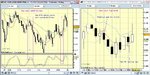
So here goes, I'm using ADVFN streaming charts for my signal (30 minute chart) with the MA Envelope overlay (5 period, deviance 0.3). I avoid any trades around data announcements and generally do not enter within the first 30 minutes.

Once the trend is clear as dictated by the direction of the MA, I wait for the price to head towards the upper or lower channel and then pullback to the MA. I enter when the price continues in the direction of the trend towards the upper or lower channel and aim for 10-20 points (target dependent on the size of the preceding price bar).

I've not been able to back test this but looking through the last few weeks charts it certainly looks promising. The obvious place for a stop seems to be just below the MA but am open to suggestions.

All suggestions/comments are welcome.
 
Pay particular attention to price when it involves these three numbers 100's 64's and 32's.
Consolidations and bounces are more prevalent around these areas.

good luck

C V
 
Hi,

What period MA are you using to determine the trend? It seems a reasonable method (haven't backtested) and coupled with basic candle/price action thrown in, it seems as likely a plan to succeed as any other, although can you tell me why your using MA envelopes, they seem a bit redundant in the method described? I'll take a look at this against GBP/USD (larger daily range and more volatile than DOW). I have been forward testing a similar but automated MA method on GBP/USD since Aug 2005 and the results so far are encouraging for a steady 'pension pot' method, nothing remarkable.

Simple methods always seem the best for long term performance; it's the patience and discipline to trade 'em that gets me in the end and automation helps.
 
Thanks CV - will look out for them, have always been cautious around 100s but wasn't aware of the others.

Aln - I'm using a 5 period moving average, with 0.3% deviation from this to create the upper and lower channel lines.

CC - Agreed the envelope isn't key to this although it does help with a potential price target. I totally agree that patience and discipline are key here, the benefit is that there are numerous signals throughout a trading session and once in you tend to close out within the next bar so don't need to screen watch all day. I stuck with the DOW because it's where I've had success in the past, i've not looked at currencies before but they're certainly on my radar for the future. I wasn't aware that GBP/USD has a larger daily range and is more volatile than DOW - so thanks for the tip.
 
dp, when you get the time, could you post a chart with some example entries/exits.

cheers.
 
...boring afternoon at work, so added standard momentum to your setup on today's 30 min cable chart. 2 trades, 1 this morning after the London open and one from the US session reversal stopped out during the 17:30 candle. ..just noticed initial stoploss on am trade should have been just under previous candle.

Thanks for the food for thought.
 

Attachments

  • Cable 24th May.GIF
    Cable 24th May.GIF
    36.2 KB · Views: 1,068
dpfuller

I wouldn't rely on 30mins chart alone. As it is a scalping system, I would use smaller time frames like 5min or 1min chart for precision entry. The use of oscillators and momentum indicators will give you nice entries. It's not too difficult to collect 10-20 points from DOW. The only thing you will need is 'patience'. Good luck.
 
leo,

thanks for the feedback. I'm trying to avoid over complicating my strategy with too many indicators initially. But taking on board your advice I'm trying a 30 min chart to determine trend (again using a 5 period MA) and then taking my signal from a 5 minute chart but only in the direction of the 30 minute trend. The entry would be on a pull-back to the 5 period MA in a 5 minute time frame. This looks encouraging so far and gives more entry points but with smaller profit targets. I'll post a chart example later.
 
dpfuller said:
leo,

thanks for the feedback. I'm trying to avoid over complicating my strategy with too many indicators initially. But taking on board your advice I'm trying a 30 min chart to determine trend (again using a 5 period MA) and then taking my signal from a 5 minute chart but only in the direction of the 30 minute trend. The entry would be on a pull-back to the 5 period MA in a 5 minute time frame. This looks encouraging so far and gives more entry points but with smaller profit targets. I'll post a chart example later.

Here is the chart for yesterday. There are two clear entries- one Long and one Short, each netting a minimum of 30points. The short trade can use trailing stop to capture maximum down move (total decline 100 points). As you want a simple sysytem, this is the plain version and quite similar to the system I am using everyday. I am using Bollingger Bands in 30min chart.

Again, the key here is to have 'patience' until there is a clear signal.
 

Attachments

  • 30minBB_5min_entry_DJIA060524.JPG
    30minBB_5min_entry_DJIA060524.JPG
    134.7 KB · Views: 1,009
Thanks, great charts. Do you generally wait for a pull-back to the 12 period ma in the 5 min chart before entering or just look for a break of it?
 
Usually, stochastics cross over/under when the price breaks 12MA in the direction of the 30min trend. Set stop a few points above/below 12MA. It works in a ranging stable market. Not for volatile news time and high powered break outs.
 
leovirgo said:
Here is the chart for yesterday. There are two clear entries- one Long and one Short, each netting a minimum of 30points. The short trade can use trailing stop to capture maximum down move (total decline 100 points). As you want a simple sysytem, this is the plain version and quite similar to the system I am using everyday. I am using Bollingger Bands in 30min chart.

Again, the key here is to have 'patience' until there is a clear signal.


Hello LeoVirgo,

Can I ask why the chart @ 10:30-10:40 is also not a trading signal?

Just curious.....


Many Thanks,

Chorlton
 
Chorlton said:
Hello LeoVirgo,

Can I ask why the chart @ 10:30-10:40 is also not a trading signal?

Just curious.....


Many Thanks,

Chorlton

Hi Chorlton

Yes, it was a valid signal. It penetrated above the longer MA line and that made me cautious. The second signal was better as it was a clear rejection from the longer MA line. Hope this helps. cheers...
 
For SB, I use finspreads. Tried IG and City, too much spreads. Those platforms are good, one touch- but I am not comfortable with 6 pts or more spread.
 
i have been looking at the Martin Shoebridge (Chartman) strategy and wondered if anyone is trading the Dow using this, and if so ,how they are doing?
I use capital spreads for spreadbets, 4 point spread - are finspreads better?
 
Prior to a few months ago I never touched indices. Now I spreadbet the FTSE and Dow intraday almost every day. I take no interest in predicting where the indices will go next day or beyond. I merely trade moving average crossovers when they happen. Using 7ema/20ema on a five-minute chart, with 14rsi taken into account, along with glances at a one-minute chart. No other indicators, no fancy patterns. No waves, percentages, or magic numbers.

I don't mind whether the market each new day goes up or down or both - though if it's both I naturally prefer a few good moves rather than lots of titchy ones.

Will post a few live examples when I get time
 
Hi dp.
Depends. Yesterday saw an upward crossover (7ema up through 20ema on the 5 minute chart) at 2:45pm BST, and the 7 stayed above the 20 all day, generating up to about 40pts for anyone who stayed with it. I didn't, I chickened out along the way more than once (17pts was the biggest amount I took in one bite). (Harry Hindsight will point out many such opportunities that were there for the taking! Being confident enough to actually stay onboard all day is another matter!)

Like others here, I am wary of staying onboard when scheduled economic data announcements are due. So I sometimes get out (or reduce to minimal stake) beforehand. I don't try and guess/gamble on what the market reaction to them will be.

I try and persuade myself to stay onboard (with minimised stake at least) as long as the 7ema is above the 20ema (or below it when short) but if the 14rsi (on the 5 minute chart) looks like collapsing away from beyond 80 or 20, I sometimes jump ship or - most times - sharply reduce my stake. I will further reduce or terminate my position if rsi crosses 50 (which it usually will do ahead of next crossover).

Ahead of what looks like an imminent crossover, I will open a bet with a minimal stake if rsi breaks through the 50 level (which it usually does just before a crossover) and will increase stake once x/o actually happens. I will increase stake to maximum if x/o proves to be a lasting one (ie hasn't reversed within 5 minutes and has moved by more than the spread). Ratio of my maximum stake to my minimal one is typically 5-fold or 10-fold. If the index is drifting sideways, this phasing or stepping of stakes helps to ensure that losses I fall foul of when x/o are shortlived are less expensive, and thus are more easily outweighed by the gains made when fully onboard.
 
Last edited:
Top