Dow Intraday Charts 25 Oct - 29 Oct

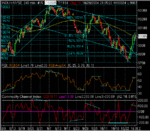
Man this thread is going into a sidewyas motion :LOL: ,well ,here are my bits and bobs, sorry couldn't post in gif style today due me being at work can't use work email for this faciltiy.Only had time for one long entry today as in chart.Reckon we'll test 10050 before we go into sideways motion.

Justyn your comments on the gap down at open,then being closed later provide further stimulation to the mind, will programme that one in at some point.


Thanks all
 

Attachments

  • DOW28TH.pdf
    27.4 KB · Views: 436
sorry should've included in the earlier post but the mouth of this triangle reminds me of film JAWS...let's see how it goes..or not
 

Attachments

  • 10 min Dow chart.pdf
    25.1 KB · Views: 334
Thursday 28th October 2004

10:12 1) S 9952. Stalls at 9950 and goes sideways.
10:17 EXIT: -5.

Out at top tick of retracement before moving straight back down and triggering re-entry which I'm not going to take as we're right on the pivot, the momentum seems weak and the bar has closed with a possible reversal pattern. I've also taking a lot of losses recently re-entering trades I've been stopped out of.

11:27 2) L 9900. I was poised to enter when it took out the previous bar high at 976 and just hesitated while it soared. So I enter again at the end of a huge gap closing up bar. Stupid. It carried on up to touch 10,000 (+9) and then reversed back to take me out for a loss.
11:35 EXIT: -2
I've got to stop this and be prepared to jump in when all is geared up to go long like this - especially as the risk, determined by the low of the previous bar, was very small. It would have given me +12 instead of -2. Waiting for the close on a three minute bar can just be far too late and I need to sort this out. Looking back, there was also a perfectly good entry at the close two bars earlier at 9974.

12:00 3) L 9900 again. Another crap entry. Going no where but into loss. A mistake but this is where I really start to hate trading 3m charts and yearn back to the 1m time frame.
12:09 EXIT -8.

12:27 4) L 9986. Better looking entry when I took it but absolutely no follow through and quickly pulls back into loss. It's getting really choppy here - the old red bar green bar shuffle.
12:41 EXIT -2.

Bad morning for me although the most costly problems have been self inflicted. 4 trades so far, 4 losers.

13:24 5) L 9996. Good looking entry except right below 10,000. Which it runs up to and bounces straight back into loss. Well that was inevitable for the second time today. Breaks through on second attempt to push towards yesterday's HOD at 10,007. Then it spikes through but reverses straight down again. Needs to hold above HOD here. Nope. I'm out at close of bar as it looks really ugly.
13:33 EXIT: +11

Well, that was a good decision for once as I would have normally been quickly stopped for 4 ticks fewer had I held.

14:09 6) L 10021. Here we go again chasing a huge 3m bar. And straight into a big loss. I've got to sort this out - it is messing up my results completely.
14:19 EXIT -4.

This is crazy. I've managed four losers out of five long trades (plus the initial short on top) on a day that's been up virtually the entire way.

14:24 7) L 10022. Back into the same trade again. Moves up better now. Then hits wall and reverses around at 10037. Next bar hits same level but cannot break through. This is dead now.
14:35 EXIT: +8.

Short all the way thereafter but while I didn't trade long against it, I didn't find any entries either. Not a disastrous day, but it did highlight a few failings in my approach at the moment.

-2 from 7
-9 for the day after commissions
+239 for October so far after commissions.
 

Attachments

  • 20041028.jpg
    20041028.jpg
    306.2 KB · Views: 195
Quite an incredible 300point ‘reaction’ rally this week in response to the year low being hit Monday, and a retracement to the 61.8% fib point of the last downleg, but with pronounced ND in many chart timeframes, plainly a pullback to test the lower support levels is likely shortly imho…….

GDP/Consumer Sentiment/Chicago PMI data to be released 13.30/14.45/15.00 could provide the catalysts to move the market.......

ps - TTony - are you making your long entries when RSI is at a low, preferably showing PD at a prior support level and short entries when RSI is at a high, preferably showing ND at a prior resistance level......? (not trying to teach gran'ma to suck eggs here - not an easy 'game' we're in by any measure....!)
 

Attachments

  • 29-10-04.gif
    29-10-04.gif
    21.8 KB · Views: 240
Last edited:
:cool: Hi guys,

All EW sources AND marketvolume sources say the same ... retrace / retest due.

TradeSmart identified 62% retrace with lots of nd ... guess we're heading back to 9700 and if EWI / Velociraptor are right, 9500 / 9600.

Only bug in the ointment is ... we're consolidating on the highs of the move from 9710 and there's a target trend line at 10250/60 which would be a nice 0.62A=C if C goes up from here.

I'm betting short from here anyway.

Regards,

Graham
 
Many participants are betting like you and from what I can see over here (Sweden) we now have a P/C-ratio (value) of 8.9 and I guess it´s the same all over Europe. MM´s will probably do all they can to kill those puts in a sharp but limited rally today. JMO, and I don´t expect it to last long because MACD is topping. Could be an interesting afternoon anyway. (FTSE 4690?)
(long)
 
Last edited:
Hi TTony

I've been reading your posts for a while now and they make great reading, pls keep it up.

I've been trading in sim mode the YM for the past week or so and notice you're comments about 1 min charts. I currently am using 3 min charts which have been ok (my method is different to yours, I look for classic chart patterns like yesterday's Shooting Star at about 4pm).

Anyhow, I've also looked at 1 min charts, but not traded off them. Why did you switch to 3 min charts and do you think they're easier to trade with?

Thx in advance.
 
The Beyonder said:
Hi TTony

I've been reading your posts for a while now and they make great reading, pls keep it up.

I've been trading in sim mode the YM for the past week or so and notice you're comments about 1 min charts. I currently am using 3 min charts which have been ok (my method is different to yours, I look for classic chart patterns like yesterday's Shooting Star at about 4pm).

Anyhow, I've also looked at 1 min charts, but not traded off them. Why did you switch to 3 min charts and do you think they're easier to trade with?

Thx in advance.

I haven't reached any conclusions yet but the biggest problem for me (as one who waits for the close of a bar before entering) is that occasionally you end up pulling the trigger at the end of a long bar when the momentum is (at least temporarily) exhausted. Against that, they keep you in a good move for longer. Swings and roundabouts I guess. I could enter sooner, but am not comfortable with that at the moment, so instead I'm going to give these entries a wide berth for a while. I've had a better month using the 3 m charts (assuming no catastrophes this afternoon) but I've been tinkering with all sorts of things this month so it's hard to know how much impact the change in timeframe itself is responsible for.
 
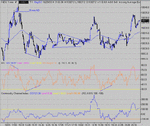
Winding up for a move North? Or South?
 

Attachments

  • dow 29-10-04 10.gif
    dow 29-10-04 10.gif
    28.6 KB · Views: 203
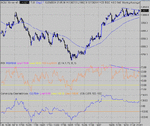
Yuk, back to the messy no range day's of recent past..... If you were on the ball, and fancied a "risky one" you might have made 40 odd from the open ND.... A day of total whipsaws. :eek:
 

Attachments

  • dow 29-10-04 1.gif
    dow 29-10-04 1.gif
    27.7 KB · Views: 273
Friday 29th October 2004

I guess we were overdue a day like this...

9:45 1) L 10018. Moves up nicely to +13 during the first bar. Then possible double top at 10030 and ugly pullback.
9:51 EXIT: +1. +13 to +1 is not great.

And out just before the huge up bar on the economic numbers. I won't chase it today (so watch it carry on up!). No - it came back down after touching yesterday's high so I got that right. I'm going to steer clear of chasing the end of long bars for a while.

Passed short entry at 10:45 because it was the end of a big bar again. This one continued into profit but I would have been stopped for just +1 or 2 so nothing much lost. Very choppy action today.

11:39 2) S 9992. Finally tempted back in. Moves nicely then forms horrible doji.
11:45 EXIT: -4. I think I just need to exit at the close of these doji bars - I always seem to get stopped out for a few points worse if I let the trade run. This would have been -1 instead of -4.

I stayed and watched until 3pm est without taking any more trades and then gave up.

-3 from 2
-5 for the day after commissions
+234 for October after commissions

A better result than September despite endless tweaking with my trading and numerous bad mistakes along the way. It is still nothing to get too excited by though and I think it was an easier month - the ranges back in September were unreal. Now I need to start gently scaling up the contracts, getting a bit of consistency and hopefully I might even be able to pay a few bills from trading profits before too long.

Many thanks for all the comments and encouragement along the way.
 

Attachments

  • 20041029.jpg
    20041029.jpg
    305.2 KB · Views: 247
Top