You are using an out of date browser. It may not display this or other websites correctly.
You should upgrade or use an alternative browser.
You should upgrade or use an alternative browser.
tradesmart
Experienced member
- Messages
- 1,286
- Likes
- 22
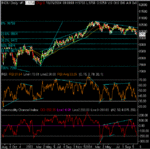
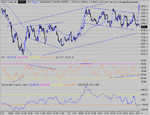
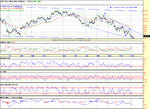
Yes, down CM – and the big picture is now showing what looks remarkably like a bear triangle……
No sign of RSI or CCI making a bottom yet…
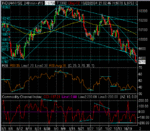
And the channels in the shorter time frames that might have given the bulls some hope are breaking down….
Now that the previous bullish patterns appear to have been negated, could we now see a test of the 38.2/50% fib retracement levels of the big move up from the 'bottom' in March 2003….?
But perhaps some good news will take us by surprise…..! ....... 😉
Attachments
trendie
Legendary member
- Messages
- 6,875
- Likes
- 1,433
general question:
do Direct Access providers have the facility for trailing stops on trades ??
specifically, does IB provide this ?
( my stop-and-reverse seems to be profitable over the past 3 weeks, and with a bit of tweaking I may have something ( famous last words ), but trailing stops are part of the plan. D4F, FinSp, dont provide trail-stops ).
alternative question: do you know any SBs that have trail-stop facility ?
thanks
TraderTony
Active member
- Messages
- 180
- Likes
- 1
trendie said:general question:
do Direct Access providers have the facility for trailing stops on trades ??
specifically, does IB provide this ?
( my stop-and-reverse seems to be profitable over the past 3 weeks, and with a bit of tweaking I may have something ( famous last words ), but trailing stops are part of the plan. D4F, FinSp, dont provide trail-stops ).
alternative question: do you know any SBs that have trail-stop facility ?
thanks
Many use a 'front end' with IB to make order execution much easier. I use ninjatrader (ninjatrader.com) and you can set up strategies whereby on entry, for example, an automatic trailing stop, target and even (I think) stop and reverse will be instigated. This can be on all contracts or partial contracts etc. These can all be adjusted at the click of a button and all outstanding orders are cancelled when a trade is closed.
TraderTony
Active member
- Messages
- 180
- Likes
- 1
Monday 25th October
9:51 1) S 9722. Moves well but big potential PD forming on CCI.
9:57 EXIT: +8. Tempted to hang on for push to 9700 but nice to get some points in the bag.
10:30 2) L 9744. Horrible entry chasing big gap closing bar - should have left alone.
10:33 EXIT: -9. Never in profit. Really ugly trade.
10:51 3) L 9727. Looks like it could just be a bear flag. Ugh.
10:51 EXIT: -5. Straight out on a spike down then it goes back up and I should still be long.
10:57 4) L 9743. Into the trade above but at a massively worse price. Today is going horribly wrong already.
11:02 EXIT: -8. The last three trades have barely even been in profit, let alone closed in profit.
Really choppy action between Friday's low around 9740 and 9700. Can't decide if it's put a bottom in. Probably best left alone until it's worked out which way next.
13:11 Looks like it may finally be breaking up and by sitting out I've missed the breakout, but you can't easily have it both ways. Trouble is, it's often really hard to get back in again once it has broken. It looks like I may have done better continuing to trade as the smallish losses would have been more than offset by the profits on the breakout.
I just can't find a trade here - very frustrating.
14:12 5) S 9751. Again chasing a long bar - this time down. It cannot break 9750 and is going to be the forth consecutive loser.
14:15 EXIT: -6.
14:21 6) S 9750. Oh dear, this time I'm chasing the same short trade over and over.
14:24 EXIT: -2. Five losers on the trot. And then the price crashes down. Unreal. Soon chops back up though.
Red bars following green bars following red bars following green bars. No more trades but already too many taken.
How I hate losing days.
-22 from 6
-28 for day including commissions
192 for October so far after commissions
Attachments
tradesmart
Experienced member
- Messages
- 1,286
- Likes
- 22
Well at least the months points are looking very positive TTony, so well done for that….!
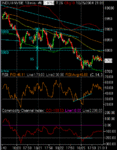
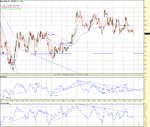
Looks like the bear triangle from the 10min chart has delivered its target to around 9700 ish and we might see a small upleg to at least test resistance in the 9800 area….
Some ‘growing room’ available on both RSI and CCI imho………..
Looks like the bear triangle from the 10min chart has delivered its target to around 9700 ish and we might see a small upleg to at least test resistance in the 9800 area….
Some ‘growing room’ available on both RSI and CCI imho………..
Attachments
trendie
Legendary member
- Messages
- 6,875
- Likes
- 1,433
TraderTony said:Many use a 'front end' with IB to make order execution much easier. I use ninjatrader (ninjatrader.com) and you can set up strategies whereby on entry, for example, an automatic trailing stop, target and even (I think) stop and reverse will be instigated. This can be on all contracts or partial contracts etc. These can all be adjusted at the click of a button and all outstanding orders are cancelled when a trade is closed.
thanks TT for your help,
have seen the ninjatrader video overview. looks promising.
Niothing in this game is clear cut, but if this is yet another bear flag, I get a target of 9580 is, allowing for another paek to finish 3 cycles. Just as a matter of interest, I've counted 7 waves down so far, this bear flag being the eigth. That's a lot isn't it?( could even be 9)
Attachments
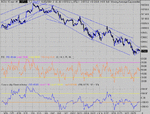
This shows the 10 min bear flag forming. There should be another high to 9800 ish to complete the 3 cycles. Then, if it's going to deliver, a drop through 9750 to start the drop to 9580.Expanding triangle failed to make target of 90. Second half of the session shows bull flag with target of 9800
Attachments
tradesmart
Experienced member
- Messages
- 1,286
- Likes
- 22
Can the channel save us?
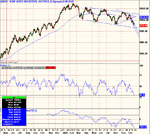
Attached the daily chart showing the triangle first pointed out by TradeSmart on 12th Oct. Triangle target looks like 9400 although there were only two touches on both support and resistance before it broke.
We also appear to be in a well defined down channel going back as far as the springtime so providing the channel holds we shouldn't see the southern side of 9650/9600 for the time being at least ... but a channel is only valid until it breaks. RSI & CCI on the daily chart are also nearing oversold.
Justyn.
Attachments
trendie
Legendary member
- Messages
- 6,875
- Likes
- 1,433
My day-trading experiment has helped me to take losses !!
( I have made around 200 points in 3 weeks. Using a mechanical stop-and-reverse )
But it also appears to suggest day-trading is essentially chipping at the market.
In those 3 weeks the market has dropped around 400 points.
( admittedly, this is a small data sample )
I think I will be reverting to EOD trading.
And I shall get away from screen-watching all-day.
wasn't an easy day at all more of scalpers day, the gaps created kept me in although I caught the break @ 9738 but didn;t hold it till the end due thinking it'l break back down but got my 20 points, was out @ 9768, only to loose more than half of it near the end, should've just shut up shop after the first trade. 😱
Attachments
Hi,
My longs from last week are still underwater but less so, Gott sei dank. I've added a couple more longs at the lows here.
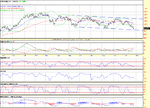
I've attached 2 charts which hopefully are self explanatory. In essence I believe the market should be heading back up to the UTL of that daily bull flag. It looks like we're finishing an ending diagonal, possibly with one more drop to come (min. 9550, possibly 9635 - 9675, likely retest of lows around 9700, possible truncation higher than 9700 ... take your pick).🙂
There's a W.X.Y.X.Z pattern off the highs earlier this year. The Z is a triple subset described as an ABC ... the C wave is the ending diagonal suggested. The ending diagonal lower trend line can be drawn to show a complete pattern or small 5th to come, I've drawn it to show one more drop to come ... call me a pessimist.🙂
My guess fwiw, is we're heading back up to 9800, 9860, 9960, 10260 and then "one step beyond" ... with apologies to Madness.
Caveat emptor.
Good luck to everyone with their trading today.
Regards,
Graham
Attachments
Last edited:
TraderTony
Active member
- Messages
- 180
- Likes
- 1
trendie said:My day-trading experiment has helped me to take losses !!
( I have made around 200 points in 3 weeks. Using a mechanical stop-and-reverse )
But it also appears to suggest day-trading is essentially chipping at the market.
In those 3 weeks the market has dropped around 400 points.
( admittedly, this is a small data sample )
I think I will be reverting to EOD trading.
And I shall get away from screen-watching all-day.
Interesting thoughts Trendie. I view EOD and intraday as playing different roles. Most of my money is currently committed to EOD activity and I hope this, over time, will be a wealth creator for me. However, these funds can be subject to long flat periods and even significant drawdowns. By contrast, my objective with day trading is to be able to make an income month in, month out. If I can return in excess of 200 YM points a month after commissions irrespective of the market activity I reckon I can pay all the bills by trading multiple contracts. I also think it accelerates the learning as I am seeing so many more setups and can then apply the same principles to EOD activity. But then I'm sad enough to love looking at charts all day long!
trendie
Legendary member
- Messages
- 6,875
- Likes
- 1,433
TT,
I start a new project in two weeks, so this experiment with day-trading was to establich whether I could do it. ( I gave myself six weeks for this experiment )
I think I may have cracked it, what with taking losses, etc, and the trading became boring and monotonous. I understand that is a good sign !!
If 200 points a month is a good thing, then maybe I should reconsider !! 🙂
It IS @ £20 a point.....
CM :cheesy:
Similar threads
- Replies
- 0
- Views
- 2K

