You are using an out of date browser. It may not display this or other websites correctly.
You should upgrade or use an alternative browser.
You should upgrade or use an alternative browser.
FetteredChinos
Veteren member
- Messages
- 3,897
- Likes
- 40
sure is... lets rock 🙂
how about a bit of down then up for tuesday?
then some up then down for wednesday?
then a bit more down on thursday?
crucial levels are 10850 to the upside, and 10,680 to the downside. these S&R should contain most of the action this week.
🙂
how about a bit of down then up for tuesday?
then some up then down for wednesday?
then a bit more down on thursday?
crucial levels are 10850 to the upside, and 10,680 to the downside. these S&R should contain most of the action this week.
🙂
I admire your systematic approach.FetteredChinos said:sure is... lets rock 🙂
how about a bit of down then up for tuesday?
then some up then down for wednesday?
then a bit more down on thursday?
crucial levels are 10850 to the upside, and 10,680 to the downside. these S&R should contain most of the action this week.
🙂
FetteredChinos
Veteren member
- Messages
- 3,897
- Likes
- 40
well my guess is as good as anyone's... 😉
markets are closed, and god only knows what can happen in the next 24 hours..
you can cut the tension with a cricket stump...
markets are closed, and god only knows what can happen in the next 24 hours..
you can cut the tension with a cricket stump...
DarthTrader
Newbie
- Messages
- 9
- Likes
- 0
FetteredChinos said:you can cut the tension with a cricket stump...
LOL!
FC, where do you get your analogies from??
FetteredChinos
Veteren member
- Messages
- 3,897
- Likes
- 40
im afraid i cant take all the credit on this one..
it was Murray Walker from a few years back..
The Brundle isnt a patch on him, sadly...
it was Murray Walker from a few years back..
The Brundle isnt a patch on him, sadly...
FetteredChinos
Veteren member
- Messages
- 3,897
- Likes
- 40
everyone got their shoes polished, mouse fingers properly rested after the weekend?
looks like my gap down to 10,760 is nearly there...
probable re-test of 10,820-10,850 again..
will the triple-top be enough to send us down and plummeting sub 10,000 this year?
looks like my gap down to 10,760 is nearly there...
probable re-test of 10,820-10,850 again..
will the triple-top be enough to send us down and plummeting sub 10,000 this year?
FetteredChinos
Veteren member
- Messages
- 3,897
- Likes
- 40
right, we're off.. long at 10760
retrace to the midpoint of friday, and if the pattern is to hold, we should see a bit of a bounce over the course of today.
FC
retrace to the midpoint of friday, and if the pattern is to hold, we should see a bit of a bounce over the course of today.
FC
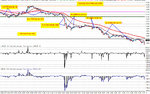
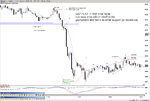
Pretty straight forward if you read the action - failure to break res. and the short ND could have prompted a swift short. IF that was not enough, then the loss at the crunch line at 30 or so should have done it, with a straight drop to T1 and a hold to the close.....
Attachments
dc2000
Veteren member
- Messages
- 4,766
- Likes
- 129
But sooner or later, something will go against the plan
Depends what plan you work to!!
170 points easy life 😀
TraderTony
Active member
- Messages
- 180
- Likes
- 1
tradesmart
Experienced member
- Messages
- 1,286
- Likes
- 22
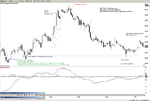
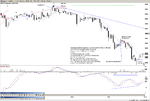
Another falling wedge triangle as a result of yesterdays rout…..
Typically they break to the upside as we saw with Friday’s version….
If this proves to be the case, a 10680 target is suggested……
But today the market is awaiting CPI data at 13.30 and Oil stocks at 15.30 so no dead certs in any direction imho…… 😕
Typically they break to the upside as we saw with Friday’s version….
If this proves to be the case, a 10680 target is suggested……
But today the market is awaiting CPI data at 13.30 and Oil stocks at 15.30 so no dead certs in any direction imho…… 😕
Attachments
Down tomorrow?
Hi everyone, haven't posted in a while but I keep popping in to read the posts. Thanks for keeping the Dow thread going everyone.
After that big push down yesterday it looked a safe bet that there would be a pullback. It looks very much like the pullback is a bear flag which would suggest we're headed for 560 ish?
The longer term chart looks to me like a head and shoulders with a double head at 850.
And just to be even more bearish ... the daily chart also looks like we have a double top and 350 will be the decision point.
Comments welcome on a postcard ...
Justyn. 😆
Attachments
justyn said:It looks very much like the pullback is a bear flag which would suggest we're headed for 560 ish?
The longer term chart looks to me like a head and shoulders with a double head at 850.
And just to be even more bearish ... the daily chart also looks like we have a double top and 350 will be the decision point.
Hi Justyn, good to hear from you. Hope your family are well.
I'm with you for the bears.
Regards,
Graham
Similar threads
- Replies
- 0
- Views
- 2K
- Replies
- 0
- Views
- 1K