TraderTony
Active member
- Messages
- 180
- Likes
- 1
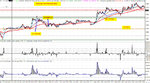
Missed the break to the upside right off the pivot.
10:17 1) L 10714. New HOD and stops to b/e. Then pulls back.
10:21 EXIT: B/e
[Alternative hypothetical exits: Trailing stop = B/e. Target at +6 hit, +12 not (average +2 from 3).]
10:55 2) S 10697. Nope. Going no where.
10:56 EXIT: -5. I was anticipating momentum rather than waiting for it to develop.
[Alternative hypothetical exits: Trailing stop = -5. Target at +6 not hit, +12 not (average -5 from 3).]
Drifting drifting. Slowly upwards but never felt fast enough to trade. Until I missed the explosion up just before 1:30 but I didn't see a decent entry.
13:46 3) L 10737. Just in case we actually get some follow through rather than one random spike. Stop to b/e at HOD. Charts lagging again - not very helpful. Stalls at 750 level and slams down again. Heavy resistance here looks likely to kill trade with three failed attempts to push through. No one ready to but over 750 yet. Flag should give T1 of about 770 to make my 30 points but I'm not optimistic. Just like yesterday the Dow will not follow through while the nasdaq and russell have no such reservations. And down she slides.
14:33 EXIT: B/e. Just give me a break here.
[Alternative hypothetical exits: Trailing stop = +7. Target at +6 hit, +12 hit (average +6 from 3).]
-5 from 3
-8 for the day after comms.
+87 for February so far after comms. (8 trading days)
Hypothetical alternative exits:
Using +6/+12/+30 targets = +3 average
Using swing high/low trailing stop = +2
It has been painful last couple of days actually getting into some good trades that seem certain to follow through only to have them keel over and run out of steam. If you haven't caught the first thrust there has been no further trending action. But that's just the way it is sometimes.
The challenge with periods like this is to preserve capital and wait for more favourable conditions. As I mentioned above, that means not trying to anticipate trends but waiting for clear action - something I struggle with.