bansir
Well-known member
- Messages
- 494
- Likes
- 42
nice channel breakout
Hi CM,
Yes, well behaved patterns today.
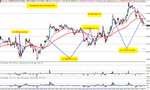
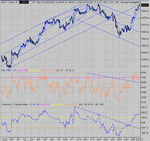
A potential channel breakout available too I thought, from the off with possible entries at pullbacks A or B. Target just met at 10,670.
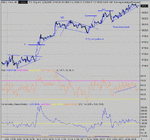
A 90 point range on the day was fairly generous I thought considering yesterdays was pretty wide.
Best Regards,
Neil
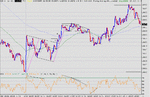
ChartMan said:Slow drift up all day with plenty of divergences.
Hi CM,
Yes, well behaved patterns today.
A potential channel breakout available too I thought, from the off with possible entries at pullbacks A or B. Target just met at 10,670.
A 90 point range on the day was fairly generous I thought considering yesterdays was pretty wide.
Best Regards,
Neil