Anmolway I used to watch dow/nas/Sp but got confused. There is substance to the fact that if all three are insynch, then the move is "confirmed".... If they're not, then take care, as you found out tonight. Like a lot of others, I reverted to "simple".
You are using an out of date browser. It may not display this or other websites correctly.
You should upgrade or use an alternative browser.
You should upgrade or use an alternative browser.
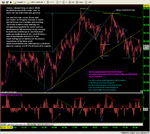
Ooerr Mrs. At least we now have decent dtata for channel confirmation.... So much for the triangle- at least it tried.Closed at the magic 64, a nice omen, if you believe that sort of stuff... and with RSI at 20, there's loadsa room above to move up.....to 764 , I hope. :cheesy:
Attachments
An easy long to start off the triple bottom, but the rest was a mystery tour of unfulfilled promise. First the ND top that looked like it was, but then turned around with avengence... A bull flag that failed and promptly reversed off a short double bottom.... That made an Inv. H&S that looked like it was going to break 750 , having made target of 746....
But then if you took a short here, there was a nice out on the PD bottom and into a long..... and the killer punch. Still, time enough to get a short on....if you had the bottle.
I've never seen so many rules broken in a day. If ever you needed proof that nothing is certain in this game, today was it. And yes, I did get caught.😱
Is this a precursor to channel failure, just as we would most expect it to bounce off support?
Attachments
morining, hmmmm well it did seem i sounded the death toll with the rally yonder 734/6 in final 45 min session, thankfully i didnt jump the gun either way as i was just out of ndx after 7 hours intense gama screen exposure, but looking at the charts dow,ndx,sp500 around that period i noticed the sp500 was clearly bear flag formation below its relative reactive lows of earlier trading, the ndx was below 1500, terrible upside for ndx all session relative to dow.
The point im trying to make is i pay attention to indexes and how they are performing relative to each other, dow ,sp, ndx, an error with hindsight for me was neglecting to chart sp500, that gave a good indication that dow fall was highly probable as its bear flag was greater defined whilst the dow was whipping slightly upside, thats why i closed my short ndx at1498 anticipating dow at 730, but if i had the sp500 chart up then i would of noticed that the rally potential was far from probable and more downside booty would be offered.
so i closed on a 50/50 decision ndx bearish failing 1500
dow possible break of 734/6 upside stemming fall of ndx.
reality 2-1 bear charts.
sp500 not being watched by me. clearly bearish,more advanced than dow,clearer definition ,fall Very Probable, ndx to continue down, dow to break.
so its a reminder for me to WATCH ALL THREE.
looks like its right on top of hourly support trend around 10660, nasty looking needle formed on the daily chart maybe the dow will churn between 10660 and 750 for a couple of sessions in the triangle, i cant see it exploding either way today,(famous last words,gulp) maybe next week we'll get the decision on the medium term.
jd
tradesmart
Experienced member
- Messages
- 1,286
- Likes
- 22
jsd – food for thought - I’ll certainly continue to watch other indices, and monitor certain key stocks for advance signals, but only a fleeting glance – main concentration on the Dow…..
Wellshot – I’m glad to say that all my trades records are in my online account database, so that’s one less chore, and I certainly pore over historical charts to help identify recurring chart patterns, and recur they do…….you need hindsight to hopefully develop the crucial foresight…
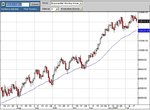
Chart below:- looks like there could still be some semblance of a triangle developing, as indicated by the erratic price action of the last few sessions; more for technical/geometric reasons than any basic change of sentiment imho. The futures have bounced back to around 10700ish this morning. Some evidence that bull markets do not give ground easily….!
Wellshot – I’m glad to say that all my trades records are in my online account database, so that’s one less chore, and I certainly pore over historical charts to help identify recurring chart patterns, and recur they do…….you need hindsight to hopefully develop the crucial foresight…
Chart below:- looks like there could still be some semblance of a triangle developing, as indicated by the erratic price action of the last few sessions; more for technical/geometric reasons than any basic change of sentiment imho. The futures have bounced back to around 10700ish this morning. Some evidence that bull markets do not give ground easily….!
Attachments
tradesmart
Experienced member
- Messages
- 1,286
- Likes
- 22
Quite an amazing reversal in the evening session compared with the negativity of earlier, apparently fuelled by Sir G’s soothing comments on the labour market….!
Took a small long a 10590 underpinned by 3-peak PD on the 10min chart, and couldn’t believe the way it took off when it hit 620…!........but didn't hesitate to go short at the ND double-top at 670 (knew the excitement wouldn't last....... 😎 )
ps – apparently seasoned observers can read the lines on Alan’s face like a chart and work out where interest rates are going……..bull/bear flags, waves, ND/PD……it’s all there…….😉
Attachments

Last edited:
Bad stuff , eh? Thats what I call a follow on from a bummer of a day. Channel dropout. Hind sight tells me that I didn't see the RSI divergence creeping up over 3 days. I guess I ( we) were all too busy looking at the triangle and expecting up. 🙁
Is it just a coincidence that the bottom ended where it did, or did it just reinforce the channel theory?
Great results in the Comp. Pity TwiggyTwo didn't get her entry in a day earlier, to pip everyone on consistency. Well done, and bad luck .Well done to TS Gekko and Flyer . Who's Flyer?
Is it just a coincidence that the bottom ended where it did, or did it just reinforce the channel theory?
Great results in the Comp. Pity TwiggyTwo didn't get her entry in a day earlier, to pip everyone on consistency. Well done, and bad luck .Well done to TS Gekko and Flyer . Who's Flyer?
Attachments
Similar threads
- Replies
- 0
- Views
- 1K
- Replies
- 0
- Views
- 2K