Dow Intraday Charts 17 Feb - 20 Feb

bgold

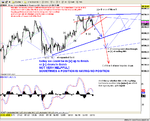
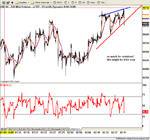
I am totally ignorant of EWA and appreciate the targets you have applied to your charts.

One question......... the posts that I have read recently on this site and others with regard to EW appear to point to a bearish consensus, is that the overwhelming conclusion that can be drawn from recent price action or does EW allow the potential for 800 and beyond ?
 
OES
The consensus among EW analysist is bearish but in order to be perfect from an wave analysis point of view, wave (c) of (v) still needs to play out and push the market higher in next 1/2 days. Ideal closing target is around 10775. Thereafter, there should be a considerable pullback/correction or more.
Please note this is only one view and outcome is most certainly not cast in stone. Note that in last years' rally EW analysts have been calling the top ever since April!!! But that doesn't mean that current analysis turn out to be valid.

Just trade what you see.
 
Guys I thought I'd add on that there are a few time cycle traders on tactical trader that are expecting a major turning next week.

Again, as BGOLD said something to bear in mind only as their time cycles are not always accurate.
 
don't know whether this adds much

elliott!! a subjective experience!!
 

Attachments

  • snapshot-52.png
    snapshot-52.png
    54.7 KB · Views: 566
Let's see how this dubious pink triangle plays out. I'm chuffed to see it has attracted some attention :D

Looks like the dollar may have had a key reversal yesterday - bullish engulfing candle, outside day up - and since stocks have been inversely correlated with the mighty greenback of late I'd say they would be likely to correct on further $ strength, esp given the refusal of Naz to confirm recent Dow/SPX highs, dismal internals blah

So FWIW my virtual money's still on flat-to-up @ Fri's close, perhaps with a failure high, then a big downdraft next week.

indu.jpg
 
Frugi - triangle worked a treat so far , $ has hit some resistance at y'days high and if we correlate it to the dow it is a circa the same level as the top triangle line..............interesting.

As I type $ is showing signs of weakening, will we see the dow drop too ?
 
Shark,

I think the Dow might actually go down on dollar strength, but I don't really understand the intermarket relationship. :D
 

Attachments

  • clipboard.gif
    clipboard.gif
    34 KB · Views: 511
Looks like the triangle that we’re all watching now has a flat top, and no prizes for guessing where resistance is ;) ………the only question is, can it get through……..?

The index is bouncing up off the rising 100ma on the 1 min chart, so seems bullish for now…….but that could soon change...! :confused:

ps - limited support from the Nasdaq.....
 

Attachments

  • 19-02-04.gif
    19-02-04.gif
    16.6 KB · Views: 485
hmmmm, long day for me short ndx @ 1519, closed 1498, dow showing great staying power around 730 maybe rally to end yonder 734/6

jd..
 
a tad optimistic jsd, in the light of the last 5 minutes action - the expression 'bull trap' springs to mind........ :eek: !
 
Lol JD You sounded the death bell for the Dow. I got out of my long just in time.
 
Bush talking on potential tax increases and the economy caused the drop...............although it could have been JD :cheesy:
 
Nah - it was me covering my short 750-725 that did it............ :(

I could see that last 1/2 hour rally coming on........ ;)

edit - it has to do these irrational things when it's making the 'perfect triangle'............. :cheesy:
 
Last edited:
Guys i am experimenting looking at sox/ndx/spx/dow all in 5min. I saw the neg div on rsi 1min to go long just after 8pm, but what kept me out was sox and ndx which were going lower as spx and dow were resting on support.

Does anybody else monitor these four together? Was this a rare observation?
 
Anmolway – From my own experience, I think that I that it gives a trading advantage to monitor other indexes when trading the Dow, as signals from one can affect the others….

Personally I just monitor 10 min chart windows for COMPX and SPX in conjunction with my main Dow charts, but $SOX doubtless relates to what the Nasdaq is doing…..

Certainly, the Nasdaq being in the red cast some doubt this evening on the Dow retaining its levity, and so it came to pass…….

It all depends on how many signals you can take in without getting confused…..(not many in my case….. :confused: !)
 
"It all depends on how many signals you can take in without getting confused" - HOW VERY TRUE.

I had the same problem in terms of what I was looking at and have drastically cut down now.

Going back to the sox. I was following chinaa white's thread a while ago and they were discussing the indices to monitor. Hope I haven't got it wrong but I think I read that:
sox leads ndx which leads spx which leads dow.

I know this isn't always true. But I thought it was in the main.
Will clarify by asking again
 
Hi Ammolway, I too monitor the Nas and the S@P when trading the Dow you can see when they are in sync and work out who is leading who. The Dow was always struggling pm against a choppy S@P and the Nas was in a downtrend. I like to see what the Europeans do in the day as well to see where they think the Dow is going. If trading the Dollar I try to see what gold is up too.
The other thing I have been doing recently is following these stocks to give a broad picture of the market.

Citigroup
General Electric.
Ebay
Microsoft
General Motors

I got this idea from Traders Mag they recommend you follow these for a wider view of the indexes as they lead them slightly. Hope this helps .
 
Cheers Schoe, really apreciate your input.

The point about the five stocks you mentioned does ring bells and it seems very appealing. I was untill recently following a group of traders on tactical trader who base there decisions on the following:

tick
trin
vxo (new vix)
comp
and Merill Lynch (MER)

They way they use MER, a major financial institute, is the change in price is monitored on the day to determine the stength of bull/bear aspect. Eg if it is >1.5 on th day then likely hood is that dow will follow suite,etc

But all ready have too many things to look at. As Tradesmart mentioned there is only so much that one can monitor without getting confused. Chartman alo mentions to keep things simple as possible which makes good sense.

Having said that if you are following these stocks please keep us all informed in how they help you in your trades.

Many thanks
 
hello

i used to watch the dow/sp500/nas100/comp
i would invariably look to say, see a final wave low on say the dow because te sp500 is putting a new low in only for the dow to truncate its last wave [not put a new low in] and i'd hesitate to go long and miss it! [this happened on 13th january at 10380ish
and got caught short!! with a massive rally.....!! now i watch the dow, thats it! it does my head in trying to watch the dow in 2 differeent time frames let alone 4 indices!
 

Attachments

  • snapshot-54.png
    snapshot-54.png
    33 KB · Views: 289
Top