Dow Intraday Charts 17 Feb - 20 Feb

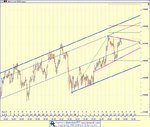
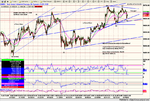
hmmm the one thing that keeps churning deep within the grey matter is the angle of ascent on the weekly chart from 7500 to present some 3000+ points with no decent retrace in view it could be argued yes but the angle rate of decline to 7500 was in fact sharper and prices can be seen creeping steadily back from whence they came. but the economy 6-12 months out seems uncertain, the dollar may well reach crisis levels, the yanks at present are happy to let it devalue to help with the glass economy and exports etc. election year froth and all that i see this as a major top for the US. and just waiting to hear "US Dollar Crisis" for the meltdown to begin.

So I'm Belly Up on the US, the ultimate stockmarket con in play.
oh the land of the freeeee, and the home of the brave...
jd.

but i'll still long it if its longing.
 
Great overview of yesterday’s action CM! – the huge waves on chart 2 are certainly food for though, and could be evidence of the rising tide that is lifting all boats (hope that I’m not ‘all at sea’ on this point…… :confused: )

Wellshot – I appreciate the dilemma – It’s easy to spend too much time projecting lines and imagining what might happen, then overlooking what is happening – I was doing that for most of yesterday ‘till RSI divergence came to my rescue towards the end of the session (it had been strangely absent earlier in the day) – simple and always the most decisive of indicators imho and always worth watching for......

jsd – In this current rally we’ve done around 3400 points in c.340 days - After the 1998 Asia/Russia crisis the Dow rose around 4000 points in c.220 days without retracement and then went on to the 1999/2000 highs with only minor pullbacks; so there are recent precedents for rallies of long duration…….true, there are always things that could go wrong……..
 

Attachments

  • 18-02-04.gif
    18-02-04.gif
    17.1 KB · Views: 573
Last edited:
Hi all

The PD & ND on RSI really does seem a very good indicator, shall watch it more closely

Kathy
 
kathy, its a pretty low risk way of making a few points (as long as u have stops in place) . Trubble is u have to wait a while for them to happen - and if u're impatient like me it's very frustrating to sit around ....

But its great for confidence building as long as u have the discipline.

I don't :(
 
I've spawned an illegitimate purple triangle which may or may not provide the key to the next big breakout. I don't expect much movement till after option expiry which would give the Dow a chance to do its 3 cycles before breakout thing. Possibly.
 

Attachments

  • indu.jpg
    indu.jpg
    104.4 KB · Views: 528
We'll watch that triangle Frugi; as I mentioned yesterday, I'm convinced that there's a big one in the making.......

A few points on the table so far using RSI divs to confirm where short term support and resistance is……….(you could almost guess it after yesterday’s performance…! :confused: )

Seems to be the Nasdaq taking the lead today – odd! – I read that they were cashing in their tech stocks, and buying blue chips……….
 

Attachments

  • 18-02-04a.gif
    18-02-04a.gif
    18.8 KB · Views: 452
JE - trade first, ask questions later - call the bottom...?!

anyway, the answer is 'technical reasons' - it can't make a decent triangle by staying in a tight range........ :D

edit 20:47 - Hmmm – 632/40 a tad pessimistic – 647 the low! Was looking for the ‘normal’ cynical pattern of creeping the price up to sucker the longs in, then suddenly tanking it below support to take out stops - very restrained today... :cheesy:
 
Last edited:
tradesmart said:
jsd – In this current rally we’ve done around 3400 points in c.340 days - After the 1998 Asia/Russia crisis the Dow rose around 4000 points in c.220 days without retracement and then went on to the 1999/2000 highs with only minor pullbacks; so there are recent precedents for rallies of long duration…….true, there are always things that could go wrong……..

hmmm yes, but then they did have tulipamania in the form of tech world .comism i cant see any new boom on the immediate horizon comparable to .comism and the like, the whole techworld to me is just churning, compacting into just another industry sector as i see it.

hmm anyway doesn't matter as such as we short term play it, but i'd be very reluctant as an investor at these levels, unless someone had a gun to my head.

the end of play on the NDX 100 looks like possible forming H&S ,(spanning 2 sessions, top right shoulder going in now) the dow however broke its neckline this evening circa 10691, leading to the fall this afternoon , so tomorrow i see it as 10690/700 must support for upside momentum. as for the ndx100 , i think it'll penetrate neckline @ 1502 leading fall to test recent 1482/5 zone.

JD
 
Good points jsd - it will be interesting to see how it pans out.......one thought that occurs after today's action - do we now have a potentially significant double-top?! (10/60min charts etc...)

From the historic charts, 10750 ish is a very important resistance area that has caused some big reversals.......one to watch!
 
Frugi is on the right track I think.... and my curve fit attempt was a no-no. I'm still none the wiser as to where we're at. :(
 

Attachments

  • dow 18-02-04 10.gif
    dow 18-02-04 10.gif
    37.9 KB · Views: 390
Mostly boring... until the drop, so long as you got on the right side of it. A couple of TS's divergence specials so I guess he got his beer money tonight. :cheesy:
 

Attachments

  • dow 18-02-04 1.gif
    dow 18-02-04 1.gif
    23.9 KB · Views: 383
Frugi ... Looks like being an excellent call with the triangle, don't know what time scale your chart is based on, but I am looking at a 60 min chart with the triangle sitting comfortably above the 100 EMA and to me that is a clue that a break to the upside carries the greatest potential if it performs.

We had the second inside day on the trot today, this is starting to feel like hard work especially when I compare it to the Euro/$ futs contract that gave up over 200 points today.
 
Tell me about it OES, I was wondering the same thing with the eut/$ - maybe we need to convert to currency trading. :cry:
 
DOW's in ending diagonal pattern?

On 10min chart, DOW may be displaying an Ending Diagonal Pattern subdividing in 3 waves. Wave (v) of (v circled) has potentially only one more leg (c) to complete which might come near the resistance line at about 10775-800.

Interesting also what appears to be a triangle pattern. If market churns another couple of days (Friday fut expiry), the upside measure for the triangle would also come near the 10,800!

So there may be another 100+ pts to play for! Thereafter we may have to swap our bull masks for bears!

(below 10604, low of wave (iv) would imply that top may already be in place)
 

Attachments

  • 10mindow.png
    10mindow.png
    322.8 KB · Views: 326
Top