You are using an out of date browser. It may not display this or other websites correctly.
You should upgrade or use an alternative browser.
You should upgrade or use an alternative browser.
tradesmart
Experienced member
- Messages
- 1,286
- Likes
- 22
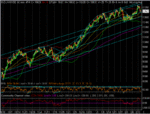
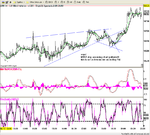
Well, as CM has oft noted, the Dow appears to like to run between parallel trendlines, as this view of the 60 min chart shows; and we’re still very much at the top of the range.
I see that the futures are up at 10685 at the mo’, over 50 points up from Friday’s close – they often seem to come back from a holiday in a buying mood…. 😀
Some commentators are suggesting that Friday’s tank was unjustified based on unbalanced Consumer Sentiment Data – Decembers’ being inflated by Saddams’ capture and Januarys’ suppressed by the infighting of the Presidential campaign - so maybe we’ll see a bounce back today……..
Attachments
tradesmart
Experienced member
- Messages
- 1,286
- Likes
- 22
tradesmart
Experienced member
- Messages
- 1,286
- Likes
- 22
Ah, If we could see the future Kathy, what rich people we would be........... :-0
I'm certainly not getting rich on today's progress - just a small short from 10705 - 680, and I was lucky to get out of that without being whipsawed.......! 😡
It's got to break this narrow range before I take another position - it's done virtually a return trip to Friday's starting point, but has so far made a lower high, so I suspect that it's going to make a big triangle over several days before deciding fresh direction - no dead certs though....
Will wait for the move, then try and get onboard.....
One Eyed Shark
Well-known member
- Messages
- 257
- Likes
- 13
Still too early for me to put the bear hat on, though the way I trade that can change within 30 mins.
Although we are seeing a lot of noise intraday, for me the trend is most definitely still up, we still continue to see H/H's and H/L's and we are continuing to nudge higher with some degree of measurement and rhythm, highs are moving in 50 point steps and trendlines from 10 min channels providing excellent support.
A break of 750 if on target should see us bounce 800 , but who knows....?
P.S. Only posting cos this must be the most god damn boring couple of hours on record 🙁
Attachments
just wondering whether there would have been a buy after the triangle pullback on 1min chart at 10688 15:47pm - or was that too risky??
ALso spx had made a higher low when dow fell on support. and higher high when dow made lower high - within the dow triangle.
Indicating that the dow triangle was likely to break to the upside.
Hope this makes sense, and that i am not just observing nonsense.
ALso spx had made a higher low when dow fell on support. and higher high when dow made lower high - within the dow triangle.
Indicating that the dow triangle was likely to break to the upside.
Hope this makes sense, and that i am not just observing nonsense.
tradesmart
Experienced member
- Messages
- 1,286
- Likes
- 22
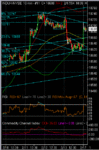
OES – hey!, we’re still in the Shark Channel , and that’s got to be bullish… :cheesy: ! Every time it has made a new high for months, it has to retest it pronto, so 10750 is very likely on the cards……the line of least resistance still seems to be up, and with stocks still in the perceived ‘sweet spot’ of the low interest rate/expanding economy environment, why should things change…….?!
Mom/Anmolway – I’m not going long just yet as we’re very close to recent resistance, and I’m a bit fixated by the falling top line that I’ve first noticed today, which seems to be resistance so far…but there’s nothing to say that it won’t blow right through this later…….third touches on resistance lines often result in a breakout…….otherwise I’m looking at a potential pullback to the lower uptrend line at 10630ish to confirm a major triangle development…….
hedge....hedge.....hedge...... 😎
Attachments
tradesmart
Experienced member
- Messages
- 1,286
- Likes
- 22
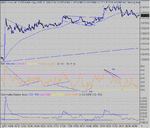
jsd - I'm now seeing an Inv H&S on the Dow/Naz/S&P 10 min charts......
Dow target 10750.......
edit 21.09 - more optimistic now - target 10800 (pity I didn't foresee today's action when I was selecting my Dow Comp entry..... 🙁 )
Dow target 10750.......
edit 21.09 - more optimistic now - target 10800 (pity I didn't foresee today's action when I was selecting my Dow Comp entry..... 🙁 )
Last edited:
One Eyed Shark
Well-known member
- Messages
- 257
- Likes
- 13
Got to agree with TS that we are looking at an inv H & S on the 5/10 and 15 minute charts.
Not only that but the intraday high for each of the last 3 trading days is 10735, now one guess at where the neckline of the inv H&S sits................yep 10735 :cheesy:
There are no guarantees in this game but if this one is going to pay it will pay tomorrow, so eyes peeled 😱
I think we are owed an easy one after today ( if there was such a thing )
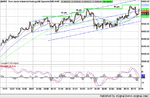
Now then Chaps and Chapesses..... This is getting very cluttered nad I go along with the views today- 750 and above , still in channels and making higher highs. There is no reason to think it won't carry on up. I'm puzzled by the apparent divergence in CCI, or is it really a bull flag in disguise? RSI can be seen to be making an expanding triangle. As it is, there's not a lot of rom on RSI unless it follows the expansion.Even so, on current strength, that would take us to the 760/70 area.
Take a look at the possible new channel, marked 1 and 2. This is forming a much steeper slope and therefore greater volatility, so take care! At the moment there are too many trees to see the wood. Hopefully, we'll see something more concrete develop over the next few days to give some real guidance. It's bit by bit at the moment I think.
Take a look at the possible new channel, marked 1 and 2. This is forming a much steeper slope and therefore greater volatility, so take care! At the moment there are too many trees to see the wood. Hopefully, we'll see something more concrete develop over the next few days to give some real guidance. It's bit by bit at the moment I think.
Attachments
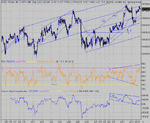
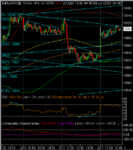
I can't see it as an Inv H&S..... there is no real definition to the form.But that's just my viewpoint. But this may put a spanner in the works- I favour the theory that the price return to Status Quo following news driven spikes. so how about taking this view, with the drop ignored....
Attachments
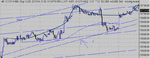
Today seemed relatively easy, given you took the long entry at the first trend line break at 690 ish and sitting it out tracking the 100EMA. The mid-day expanding triangle showed promise as the base line slope increased twice before breaking 710 and very quickly dropping into a multi ND top , failing to break 732 on 5 tries.It's a pity that the middle peak in the exp. triangle wasn't higher- would have been a good signal for a close and short ( a la TS) on ND, followed by another long entry at 696 on the short PD.Might have been another 10- 15 points that way. Call it luck, but I had a small overnight punt on a long so picked up a nice "Brucie". A rare event. Must have been the boredom of no markets yesterday. :cheesy:
Attachments
CM
On the 10 min chart you mentioned
As it is, there's not a lot of rom on RSI unless it follows the expansion.Even so, on current strength, that would take us to the 760/70 area.
How do you project points on the RSI to price moves. Do you look at 20 points RSI will push Dow up to 760/70/
Thanks
Kathy
On the 10 min chart you mentioned
As it is, there's not a lot of rom on RSI unless it follows the expansion.Even so, on current strength, that would take us to the 760/70 area.
How do you project points on the RSI to price moves. Do you look at 20 points RSI will push Dow up to 760/70/
Thanks
Kathy
As an approximation... take the RSI/Price move from 30 to 70 = 120 point move yseterday. This = 3 points per point of RSI. There is 20 points that RSI could move up today so that = +60 on the close. All guess work and smoke and mirrors. :cheesy:
Similar threads
- Replies
- 0
- Views
- 1K
- Replies
- 0
- Views
- 2K