That's the high volatility bit.... My pencillled in guess last week turned out about right- not the direction ( I didn't know) but the level at 9650 ish. 250 points in two days. Where to now though? Support at 9650 then fresh air drop to 9500. Otherwise another push up to test 9890 again? I think I might be undecided. 🙁
You are using an out of date browser. It may not display this or other websites correctly.
You should upgrade or use an alternative browser.
You should upgrade or use an alternative browser.
Clearly a day for the trend is your friend....The down trend, that is. A good example of why NOT to trust PD in the first hour... or the second, or the third.... If the market wants down , it wil go and go and go... I suppose going long at the DB at 9650 seemed a good idea... until it came up against the 100MA. It had three goes and that should have been warning enough that it wasn't going to break and 9650 was not the bottom... Enough warning to get out for a couple of points. Not an easy day and too many opportunities for being caught by the whipsaws.
Attachments
tradesmart
Experienced member
- Messages
- 1,286
- Likes
- 22
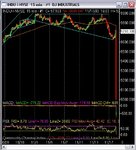
Has anybody else using SierraCharts/MyTrack been troubled by a huge spike down appearing today and screwing up the charts/indicators as below?
Would be grateful for a solution/remedy if anbody knows one....
(or is it the 'short to end all shorts' I missed at the end of play yesterday! 😱 )
Regards
Would be grateful for a solution/remedy if anbody knows one....
(or is it the 'short to end all shorts' I missed at the end of play yesterday! 😱 )
Regards
Attachments
One Eyed Shark
Well-known member
- Messages
- 257
- Likes
- 13
tradesmart
using AIQ with my track which is also spiked, have spoken to help desk who say they are working on it but cant give any timescales
using AIQ with my track which is also spiked, have spoken to help desk who say they are working on it but cant give any timescales
rossored
Senior member
- Messages
- 2,103
- Likes
- 56
Tradesmart, you have to right-click on the offending entry and then click "Edit minute data" - either delete the offending row/rows or edit the data so that its correct. I would imagine that if you look at the numbers, you'll probably find that there's a decimal point in the wrong place : I used to get the same problem with MyCrap all the time.
tradesmart
Experienced member
- Messages
- 1,286
- Likes
- 22
Thanks for the replies guys. All US index/stock charts are U/S on my screen just now,but FTSE/DAX ok.......
I'm just glad that I didn't miss the 'short' of all time - that really would have hurt! :cheesy:
Regards
I'm just glad that I didn't miss the 'short' of all time - that really would have hurt! :cheesy:
Regards
Yeah I got this on the US and UK indices and the US stocks I'm watching, all bad data after the US close last night. I found that using 'Delete from current position to end of file' from after the close worked about 50% of the time, on the others the auto-fill just restored the crap entries within a couple of seconds. For these, deleting each individual bad bar worked without them coming back - there were about 15 for example on AMZN.
Not sure why there should be such a difference in doing this in Sierra, but it seems there is.
KenN
Not sure why there should be such a difference in doing this in Sierra, but it seems there is.
KenN
tradesmart
Experienced member
- Messages
- 1,286
- Likes
- 22
rossored/knorrie - minute data successfully edited - many thanks!
Tradesmart,
Evening,
There has been a problem with sierra/MT from just after the closing bell, US.
They have been working on it most of this am, What you need to do is delete the INDU file, close & then re-open sierra.
Then type in 'INDU' in intraday chart selection.
This applies to any other corrupted chart.
Cheers.
Where are we heading tonite??
Looks like it wants to go up. There's a dodgy looking DB on the 5 min chart. Mmmmm!
Still got 15 min Parabolic above the price line.
I'll wait & see.
tradesmart
Experienced member
- Messages
- 1,286
- Likes
- 22
Hi LockStock,
All of my chart problems have been resolved simply by editing the minute data - a decimal point slippage caused the problem!
A bit earlier I pencilled in a 9760ish Dow close, but it looks weak just now - whilst its in the current expanding triangle it will remain volatile and schizophrenic imho - perhaps the Thanksgiving Turkey will bring a new upwards impetus as they start speculating about this years 'Santa Claus Rally' :cheesy:
Regards


tradesmart
Experienced member
- Messages
- 1,286
- Likes
- 22
I've seen that triangle configuration break north and south recently so will not try to guess it, but the flat RSI/CCI on the 10min chart does give a slightly negative tone........
LS - yes, did make 9760 the 50% fib level of the current move - we'll have to see if the bulls or the bears come out this evening! :arrowu: :arrowd: 😕
LS - yes, did make 9760 the 50% fib level of the current move - we'll have to see if the bulls or the bears come out this evening! :arrowu: :arrowd: 😕
tradesmart
Experienced member
- Messages
- 1,286
- Likes
- 22
LS - Douglas is a 'cool' place; particularly when the sea mist rolls in! 😎
I've had a short and a long earlier, but will see what the evening action after 19.00 brings before getting in again - after a succession on 'red' days, we might see green yet, but not taking it as a foregone conclusion.
The market is clearly at the crossroads.......... 😱
I've had a short and a long earlier, but will see what the evening action after 19.00 brings before getting in again - after a succession on 'red' days, we might see green yet, but not taking it as a foregone conclusion.
The market is clearly at the crossroads.......... 😱