Dow Intraday charts 17/11 - 21/11

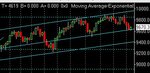
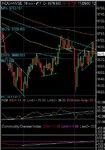
lockstock, saw it as a descending / bear triangle - TA says these thing break south so i shorted with a stoploss of 20. Looks like coming goo now.

Just wish I could do this for real - am currenty trying out CapitalSpreads demo account - got fedup with fins - seem to be having more success with CS 'cos of their smaller spread. Mind u, it's probably more to do with the fact that it's not real money .....
 
message board is busy today. Hope you guys are still short and no-one got burned.
 
To me, it was the clearer, bigger bear flag in ES that signalled the only way was down. Traded exactly to target, too - and then a bit more. Not so clear in YM - looked like a tri with a tiny false break to the upside.
 
That's the triangle done, with a failure to reach resistance so now it looks like more down. TA target is 9400. That seems too low to me, but never say no way! On the other hand, if today is a bottom, there could be one more lower low and we get a PD setup.That could turn Thursday/Friday.Maybe. Support at 9600 and 9550. CCI has room to drop to support.
 

Attachments

  • dow 18-11-03 10.gif
    dow 18-11-03 10.gif
    36.2 KB · Views: 372
Trick start, with a break of 32 ... but if it was going to go, it should have tested 9750. So an out as the 32 re-test failed. Now looking for a short, and a good entry at the 3rd 32 re-test at the top of the bear flag and that should have set you up for the day. Notice RSI ratios getting weaker on the up trends ( bear flags). A sensible out at the bottom, with divergence and failing to drop right through 9632. Best part of 100 points...
 

Attachments

  • dow 18-11-03 1.gif
    dow 18-11-03 1.gif
    26.6 KB · Views: 415
Afternoon all,


Mi thinks we could be sideways or up today,


Feel free to discuss :cheesy:
 
sideways - usual consolidation after a big move. Plus it's close to the lower trend line so needs time to make it's mind up.

Not done anything today - that long term ND is confusing the hell outa me. Be interesting (as always) to see CM's take on todays action.
 
Lockstock - sideways or up today? Can you take away one wrong answer or can I phone a friend?! :cheesy:

Well, we know part of the answer now and it’s a bit of both!! Seems a bit too bullish to provide a lower-low today, but things could change fast in the next couple of hours……..

The daily chart shows that ChartMans projection of a 9400 low soon is quite possible as it coincides with the lower trendline from June. :arrowd:
 

Attachments

  • dow 19-11-03.jpg
    dow 19-11-03.jpg
    30.6 KB · Views: 314
TS,

Watcha,

Just looking at the S&P500 it's at resistance now.

Just nipped in for a quick short, but as I have said before it's hard making the 5 pts up

Chartman could very well be right or there again we could find it back up at 9900
 

Attachments

  • x s&p500.gif
    x s&p500.gif
    35.8 KB · Views: 309
LS - As noted yesterday, I feel that we may be in a cyclic decline until the ThanksGiving Turkey is consumed, and then the fallout from that may provide a great gale of wind to propel the DJ up to 10,000 ish with Santa Claus (and me) looking on in amazement.......

Not much of this is based on T/A by the way.......! :LOL:

Just content with scalping a few points on the up and down legs earlier, but the way it's going now, I wish that I'd just stayed long. But hindsight is a wonderful thing.............

Regards
 

Attachments

  • brsanta_e0.gif
    brsanta_e0.gif
    5.9 KB · Views: 542
Food for thought:- I reckon that very often I'd be better off just picking a direction for the day at a high or low in the first hour or so, leave it and walk away returning at the end of play to reap!

Sure, some times you'd get stopped out, but a lotta times you'd come back to find that you're a hundred or so up...!

Think I'll give it a try sometime....... :confused:
 
Interesting to see if the S&P will break back into the 1045/62 range that it has been in for the last 3 weeks or so.

Now at 1043.6/44.1.

Just nipped out of the office for some tea & missed the action once again.
 
Don't think about right or wrong, direction wise. Think about are we heading towards support or resistance. Clearly , today, right from the off, we needed to head down to support on CCI for the move to continue on down. Also there was the PD across two days on RSI. We would expect this to continue if we were to go up.
So it was.
Now, we see an increase in the RSI slope so I would expect a continuation tomorrow. We now have some channel lines and you should use them as a guide for S/R. There is the possibility of a "W" bottom , with a target of 9850, so keep that in mind when calculating targets on the 1 min.
So for up, we're looking for CCI going to 100, RSI breaking resistance at 65 and the price breaking 9700. The last 3 moves through CCI zero has resulted in 100+ moves.
ES has closed consolidating at highs with RSI room to move up.
 

Attachments

  • dow 19-11-03 10.gif
    dow 19-11-03 10.gif
    33.4 KB · Views: 424
Just a quicky- I've got a dose of a cold... :(
Strange day again. long ND - wait for the support break... Mid day triangle gave 9705 target. Unusually, price target met at the apex- text book theory. Do you take the vague PD , or wait for the target?- tough call.
 

Attachments

  • dow 19-11-03 1.gif
    dow 19-11-03 1.gif
    24.9 KB · Views: 419
Looks a tad bearflagish to me, so have taken a short at 9685 with a tight s/l - all a bit dodgy with conflicting news working on the market - dire geopolitics/good economic data............ :confused:
 

Attachments

  • dow 20-11-03.jpg
    dow 20-11-03.jpg
    68.8 KB · Views: 421
hmm, i'm not convinced by this bear flag thing - always thought that for a bear flag, the pole had to be down and vice versa for a bull flag.

So, I didn't go short - waited to see what happened 'cos of what I just said above - went long on the bo pullback.

Does that mean that it was a bear flag but it failed or not really a bear flag?

Confused !
 
Hi Chaps,

Looks like an inverse H&S to me on the 15 min INDU chart.Possible target 9870?

The S&P has managed to return to the 1045/62 trading range.!!

We all see something different.
 

Attachments

  • x s&p500.gif
    x s&p500.gif
    34.7 KB · Views: 374
Last edited:
Covered would be bear flag short for a few points earlier when it bounced off the lower line at 9675 for the 4th time and headed north - clearly the bulls were winning! - will be interested to read CM's comments later re:- bear flags/H&S and all that good stuff.

Wouldn't like to predict tonites close - have lost the plot....... :confused:

ps - perhaps 'twas a very long badly behaved bear flag! - should have waited for the 3-peak ND top at 9725 - however have got on board short a bit further down - timing is as critical as ever!

pps - nice triple bottom at 9620ish - could be a 'long' now - but not overnite in case there's another security alert at the White House!! :cheesy:
 

Attachments

  • bull_whatever.orig.gif
    bull_whatever.orig.gif
    3.9 KB · Views: 569
Last edited:
LS - I'm just composing a letter to the NYSE to ask them to make their bear flags a bit shorter and more symettrical so that us bears can get on board at the right time....! :LOL: (sorry.....)

And if they can do some work on their H&S's.....

I note a 'higher high' today with a triple-bottom creating an apparent expanding range over 3-days which seems significant (for the bulls maybe!)

Regards
 
Top