Dow Intraday charts 12/05 - 16/05

ChartMan

Legendary member
Messages
5,580
Likes
47
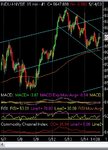
Let's start by saying It looks like I guessed the Dow Comp. hopelessly wrong. That's a good thing really because........... It just goes to show that second guessing what is going to happen tomorrow, next week or the mext minute is a fools game. Never, never guess or wish the next move. It'll cloud your judgement and persuade you to trade in the belief that your guess is going to come true. Stick with an open mind and trade what you see. Let's see why I guessed down. Perfectly sensible choice. The Dow has enjoyed a sustained up trending trading channel. The last few days provided 3 lower highs providing a nice downtrending resistance line.Friday tested this line 3 or 4 times. The triangle that developed over the 7th. and 8th. failed to break target of 8600.Having gone to channel bottom, it was reasonable to expect the price to go to channel top - 8680 area. It didn't go to channel top, so I saw this as down.

So, soon after the open, the Dow broke the minor down trend resistance line, with a pullback confirmation. Clue No.1 that we're not going down, yet.
This carried on with a pullback and target of 8690. Alarm bells.... This IS channel top. Finally channel top is broken, with pullback confirmation. Now. Will this hold or is it a fake out? Who knows and who cares......... unless you are LTBH. Now we're in "fresh air" mode. 8600 has been tested and passed . Now we should be testing 8700, with the inevitable dropback to 8600 if it fails to hold. If you see 10K round the corner, wake me up when we get there.... not before.
 

Attachments

  • dow 12-05-03 10 mina.gif
    dow 12-05-03 10 mina.gif
    26.2 KB · Views: 744
And so to today's action... Oh goody , I thought, we're going down... well that lasted all of ten minutes!.Then I saw the expanding triangle at 2:50..... Under the 100MA.... should break to the downside... The rest is history. Still, it surprised everyone in the chat room just how much strength the move had...People kept saying not much more in this....
Target one- from the confirmation pullback bottom to the top of the expanding traingle gave 8690....Surely not I thought...That broke to the upside and the triangle itself gave a target of T2... just flew past that, and on past T1. Straight into major breakout and pullback confirmation. Everyone was looking for a total failure here.... Well I wasn't. At around 17:10 I said wait for the next peak in the price- we've had two for an ND top. That was across 20 minutes. The third came in spot on, 25 mins later. And out. Good for 100- 150 points, depending on your entry.
So far we're nowhere near the 100MA, so why short? As BB said in the chat room, RSI moved 30 points for the dow's 6 or 7. Now does that sound like a short? ( around 17:15).
Over the next 80 mins we get a lazy bull flag develop- characteristic of more up after a strong move.... Looking for a short entry, but it didn't materialise. The dip below the 100MA was a possibility, but there was no pullback,just a couple oh tiny hiher lows as it went back through 8700 and off, and so a long entry again. Yet another 3pk ND top across 35 mins and out for 30.
I mentioned before in the chat rroom that you usually only get one SR switch and or one RS switch in a session. Today we had two clear examples.
A nice straight forward day today with no messing and excellent TA to follow.
If you didn't look at the 10 Min charts over the weekend, you may not have realised what was going on, and more importantly, where it was happening.
Our horizontal channel lines are now 8540, 8620 and 8700. Uptrend resistance ( now support) is at 8700 so this is now critical.....
Notice the tiny pullback from 8635 to 8632 ( magic number) and the dithering at 8733 in the final ND top. There is no reason for this . It just happens.....don't let it persuade you to close a trade in this area. Same at the64's. Is that why the open drop stopped just short at 8564?
 

Attachments

  • dow 12-05-03 1 mina.gif
    dow 12-05-03 1 mina.gif
    19.6 KB · Views: 720
Excellent

Hi Chartman
I really like your charts and analysis... they are brilliant and great for a novice like me!
Could I ask a few questions?
First, what software do you use to do your charts? They are beautiful..
Secondly, what do the SR and RS mean in the RSI chart...

Thanks very much :)
 
Sierra Charts from Sierracharts.com
SR and RS mean a trend change in RSI. SR is a change from S upport to R esistance and vice verca for RS.

Goto the bottom of this board and do a search for switch.....
 
Hi ChartMan

Been lurking here for a while (excellent website, BTW) and reading your end-of-day posts - looks a doddle with hindsight!

I noticed you mentioned "magic numbers", 8733 (was that a typo and should it have been 8743??) and 64's - do you have any further information on these or can you point me in the right direction as I haven't come across these before, or if I have then I have not made the connection to magic numbers, etc.

TIA

M&M
 
The "magic numbers" are 32 and 64. So 8632 8764 etc. It is an observation I have made, over considerable time, that the dow frequently has a pause or a minor test at these two numbers. I call them magic because I can find no explanation as to why this should be and they occur as if by magic. I doubt whether you will find any other reference to this outside of this BB.
 
OK Thanks CM. All useful things to watch for and to add to the mix of other "indicators".

By the way, was it a typo? - 8733 - I know that 8743 is a Gann number and wondered whether you were referring to it as such.

Thx.
 
No, it was a general reference to the price action that was close to the 32...you have to have a bit of leeway- 28-35 and 62-28 or so to look for it. I suppose I could have made the numbers 35 and 65 or something, bt being a computer nerd 32 and 64 seemed logical, Spock.
 
Hi Chartman
An interesting day yesterday, but one of the things you have not mentioned was that the shape from ~1650 to 1855 was the same "rolling top" that we saw on 14/04/03 with the same result!

There is a flag in there as well which "sort of" broke out before the final move.

The overall pattern was very similar the two days.
 
hi all

could someone maybe clarify my TA here? Would i be right in thinking that if the price were to fall through the support at 8700 today, theres a good chance it'll bounce back around 8580-8600 and possibly go on form a three-day H&S taken over 9th/12th/13th? Or am I reading too much into things too soon?

:rolleyes:

RR
 
hi rossored - that is one scenario which could happen as head and shoulders often appear at the tops of trend runs. Just keep an open mind though, and trade what you see happening!
 
Rolling tops is a phrase I reserve for the 10 min charts developed over several days.... Mini rolling top then yesterday :)
The key is hat there was no dropo after the 3 pk ND top, signifying market strength for the bulls
 
Just a short report tonight. Not a lot of great interest..... but I'll point out one thing that seems to be changing with time. In the past , 3 peak ND tops almost always used to fit a perfect uptrend resistance line. Nowadays, I see more and more of these things that have a "bump" for the middle peak.You need to "go with the flow" and realise that what worked and you recognised last year, may not quite be the same this year.
A down channel is developing and we need a few more days to see if this will be sustained. This could either develop into a straight down trending channel, OR it could turn into a bull flag. If it's the latter, there will be one more low and then we should see a channel breakout.It's too early to draw in meaningful downtrend lines...maybe tomorrow will show us the way...... We've got our horizontal channel lines for S&R and should play to those. Try and work out at what values the decisions will be made. What might the channel breakout value be? Where could we look for suppport if this is a developing bull flag? What do we expect to see for channel down confirmation? Do any of these coincide with horizontal SR lines?
More tomorrow.
 

Attachments

  • dow 13-05-03 1 mina.gif
    dow 13-05-03 1 mina.gif
    20.3 KB · Views: 550
I like to harp on sometimes about certain things as and when it seems apropriate. Now, channel lines is something I'm a great believer in for getting ranges sorted out. Others use pivot points, but I can't be bothered to get the calculator out.... But these channel lines are simply Support and resistance lines, drawn both horizontally, and, as up or down slopes. It's all guess work, and doesn't have to be precise as you can see from the ones drawn in. A lot of this is "does this look right". Picking the absolute peaks and troughs may not form the "ideal" channel lines as they represent extremes. Yesterday's channel lines, extended through to today gave a good idea early on that we were likely to be range bound ( understatement) and what the price would have to do to get out these ranges. Now I have redrawn the lines to give a "better fit" to include today's action. ( see the next chart).
Apart from the 100 point drop, there was little else to do today except sit on your hands and wait for something to happen or take a gamble......
I'll leave the TA for you to analyse.....
 

Attachments

  • dow 14-05-03 1 mina.gif
    dow 14-05-03 1 mina.gif
    24.3 KB · Views: 542
Now you can see I've modified the channel lines . As more input is obtained ( previous data) one can apply "better fits". The downtrend resistance line cuts through today's peak. This is "noise" and you shouldn't try to include these in your attempts to draw in trend lines. I find that those lines that work the best are often equally spaced apart. You can see at the moment that there is a bigger gap in the upper channel. This suggests to me that the "real " line should be drawn through 8670 and not 8660.That would move the top line up to 8730........ only time will tell if this would have been the better choice...... The actual number is not important. It's what happens around these numbers that is important. You just need to know that at 8660/8670 a decision will be made as to whether the market wants to bounce and drop, or fly through.
 

Attachments

  • dow 14-05-03 1 minb.gif
    dow 14-05-03 1 minb.gif
    24.6 KB · Views: 443
Hi ChartMan,
Looking in a longer timeframe, the current downtrend channel could be a bull flag - possibly confirmed by US data later today which includes jobless figures at 13.30bst.

Regards, TradeSmart
 

Attachments

  • dow 14-5-03.jpg
    dow 14-5-03.jpg
    74.5 KB · Views: 403
Hi Chartman,

Thanks for all the work you are doing on these charts. They are a great help.

My biggest problem is working out when a day is likely to be range bound and when it is likely to stay in a trend all day. I still get it wrong most of the time.

Pivot points seem to work quite well on the Dow but they do clutter the chart a bit. I have read that sierra charts can put them on automatically, so no need for the calculator!

I have attached a chart with the pivot points for yesterday.
 

Attachments

  • 14.4.04 pivot.gif
    14.4.04 pivot.gif
    18.2 KB · Views: 440
lads,

sadly i cannot enter the Chat Room getting odd messages about some infection by Fizzler Worm ?!?! cud u pls let me know u ever experienced anything of the sort?

in the meantime, have a profitable day! :)))
 
DAx and bullish bear all got the same Fizzer trojan. Check it out on Symantec's site.
 
Top