Day trading the DOW 05/05/03

ChartMan

Legendary member
Messages
5,580
Likes
47
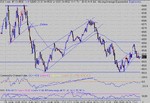
Nothing overly interesting today..... unfortunately. Triple top attempt at 8600 that failed to hold, despite the Bull triangle that developed.Clearly not ready just yet for the big push. Point to note. The last two lows before the drop failed to make support. I would normally take this as a sign of strength and inpending break to the upside. Ignore the H&S here, it only accounted for a 10 point move. Too small to be significant.
Other thing here is the pullback to resistance immediately after support is broken. This is a common feature of breaks either way.The weird "pullback" in the middle of the drop gave a target of 8510- not met on the first try, bu t almost met on the second try- close enough- BUT no follow through. This gave us a PD bottom over 25 minutes- the minimum to call a reversal and off it went.
No clues for an exit on this, you would have had to rely on the up channel break to get out around 8560.
And so another drop with a rise into the close. From the cahrt , we can see that 8550 has now become a support/res. line. So for tomorrow, we can look for 8510 and 8550 as a trading range.
 

Attachments

  • dow 05-05-03 1 mina.gif
    dow 05-05-03 1 mina.gif
    23.9 KB · Views: 855
cm:

many thanks again! just a question: I shorted 8600 basing on ND extending from the previous session on RSI (well, not only that, but also as I always do, looking at the inability of FTSE to jump - but this is beyond the point). My logic was that since monday open was close to friday's close, extending friday's ND was legit. Would u approve of that?
 
Yes, CW. If the previous day's close is close to the next open, it's fair game to rollover the TA. Otherwise there is a big unpredictable hole.
 
I take it that 8810 and 8850 trading range you are referring too for tomorrow is a 'typo'. Not picking holes Chartman. I know you want close to 8700 for Fridays finish in the Dow guessing game.
 
Nah, show me where it says 8810/8850 :cheesy: hehe
I don't do typo's. Just edits.
 
From yesterday, I said note the trading range 8510 to 8550 ( thanks, Mags) Today was a good example why you should take note of the recent past. The open tried to dip a little but came nowhere near 8510. Then a quick test of 8550 and a decision resolved to the upside. Now we can look for 8550 for support. The decending triangle tested that and then broke to the upside. You could have taken advantage of that knowledge and gone long on the bounce off 8550. Or you could have waited another 15 points.....for confirmation and a safe entry. T1 the target and follow the 100MA up. ND set in from 17:00 to 18:00- with a sting- the extra peak in RSI. When this happens, you would expect the rise to continues on as it has done in the past. A pullback or fall, then off again, but not this time. This firms up the rule of closing on the third peak. IF it continues on up, you can get back in. The odds are firmly stacked against this, but it does happen sometimes. When it does, it's not a big move, and is usually in the later session. You can go short as the uptrend support line is broken....
Now. How to deal with the news spike. Stay out! You know it's coming, don't gamble.HOWEVER, if you must, OR you get caught the wrong way, don't panick. These spikes almost always revert back to "par" very quickly. In this case, it was only 30 odd points so not too bad. More than that and you may be approaching your pain threshold, in which case you will have no option but to close for a loss. Iv'e seen them do a 100 drop and a 100 rise.... The best bet is to stay out and try and call the bottom.
Take the preceding drop off the ND top. The RSI /Price drop indicated a weak fall. Price fell 15 for a drop of 40 in RSI. Market weakness. You could use this to hold a wrong position at this time knowing the prior weakness would not be likely to result in a huge drop....... If you're looking to pick the bottom, wait for the first big up tick to complete.
This spike produced an inverse H&S and T2 target. No follow through here so another short entry. Note CCI approaching 300 at the peak. Follow the short down, calculating targets as you go- T3 and T4. Clearly the mini bear flag below T4 failed to make target...but did break 8550 support, briefly. Mini PD at the bottom here over 8- 9 mins. Maybe a cover here.... or wait to see if we get a bounce off 8550 to confirm loss of support there ...... Hard choice and could be played either way . You should have been on the right side of 80 odd points here, making the choice less critical. That bottom produced another inv. H&S with a target of T5. Followed by an expanding triangle with 8582 target. Around 150 - 200 points available today.
I make support around 8580 now.... ready for testing tomorrow, adn then back to 8550. 8630 for the upside .
 

Attachments

  • dow 06-05-03 1 mina.gif
    dow 06-05-03 1 mina.gif
    21.2 KB · Views: 767
Phew!
That news spike was something wasn't it!
It's like someone turned the gain up on the whole system.
I was nearly dosing off when that first big black bar appeared.
Happily, more by luck than judgement, I was out of the market at the time.

You said that we all knew the news spike was comming??
I guess it's a good idea to have a news feed runnng along side the chart then? Or should I be checking my diary ahead for significant announcement dates etc?

All the best,
Neil
 
Bansir - with respect, that news spike was nothing! FOMC meetings are where interest rate changes are announced, and yesterday's decision in the US was to leave the rates unchanged - so nothing!

Just you wait until they do change the interest rates - now that really IS a spike! Hehehe. From memory (rusty sometimes) I believe that in the past Nasdaq spiked 30 points in 5 minutes - something staggering like that anyhow.
 
The FTSE moved down 200 and up 200+ recently in minutes.

Yesterday didn't really constitute a spike IMHO.

JonnyT
 
Today defies analysis really. A perfect RS Switch at the open provided a great long entry.... I make the channel a bit wider now at 8549 to 8585.
Tonight is competition night. How many H7S and Inv. H&S can you count? I have never seen so many before ...... Does this mean the whole day was filled by indecision one way then the other? Lost of small moves of 30 - 60 point with nothing to get your teeth into. Very frustrating. I should imagine there a quite a few traders out there with a nice headache.
 

Attachments

  • dow 07-05-03 1 mina.gif
    dow 07-05-03 1 mina.gif
    21.5 KB · Views: 630
Here's a closeup of the RS Switch. It's coupled with PD over 35 minutes.
 

Attachments

  • rs switch.gif
    rs switch.gif
    18.1 KB · Views: 614
Thanks for the coments all. These potential sudden swings or spikes are all part of the risk then I suppose. Even if the one on Tuesday wasn't so huge there was no guarantee it was going to come back towards it's origin.
Thanks for the tip on the news link Bigbusiness.

'I should imagine there are quite a few traders out there with a nice headache'.

Pass me the asprin.
Kept trying to anticipate a downside breakout and got whipsawed pretty badly.

All the best,
Neil
 
Can anyone point me to the thread where the following is discussed:
RSI/Price ratio, S/R and R/S switches and Negative/positive divergence.
 
At the bottom of this Forum, there is a search facility. Just enter what you want to find e.g RSI PRICE RATIO , set the search for the last 60 days, and bingo- 4 posts.
 
Yes , the search engine must be supplied with 3 characters minimum. Use "switch" for RS/SR Switch. Might pick up a few other posts though. Another solution is to download the archives done by Newtron Bomb. These are in WORD format so when you load them, you can search within the document using WORD's search.
HTH.
 
Bit of a mixture today. Some good TA top follow, and some messy bits like yesterday. At least the messy bits weren't too volatile, enabling a hold and see without too much fear and panick.
First up the futures dropped big time early on pre-trading so it was guess the bottom time. As it happened, it was close to where the futures was just prior to the open. The break back through 8500 with a mini PD signalled a long. Then the wait while the triangle resolved. Nice clean break on that, followed by a swift confirmation pullback to the 100MA and off, with T1 as a target. No real clues after T1 except the 1 tick pullback allowed a target point that didn't make it. That was 8585.
In the Chat Room , China White pointe dout the SR Switch on RSI that I hadn't seen - turned out to be an excellent call. Don't expect these to deliver immediately- they rarely do, patience being the order of the day. It's a cue to start looking for a short entry. There wer plenty to chose from- all the peaks in the triangle. I made an excellent call ( NOT!) saying that the triangle was weighted above the 100MA ( balance of power) and would break to the upside. Of course, it didn't. They usually do, but as I said, a good example of trading what you see ( and know) but the market thinks otherwise. If you went long, close it without a fuss. Always be prepared to know where your exit point is on TA failure. In this case it was as the triangle broke to the downside at 8540/8530. There was just enough time to get out before the big drop as the price tested the 100MA for resistance two or three times just under the triangle. Two other clues were the failure to make inside resistance twice around 8550. Weakness also shown in CCI<100.
So that break gave a target at T2. Mid move there was a pullback giving target T3 and here there was plenty of time to gather thoughts and plan an exit.- as the price passed through 9490.
That was about all that was worth trading. The final flag had a target of T4, a measly 10 points and a long here would have ended up a loser- but you can't know that at the time.
The rest of that day was messy and may well have caught a few of you in whipsaws. This is where the 100MA rules really pay- stick to your trade whilst the price is inside the 100MA +/- 20. Trading each reversal would have been a losing trade on SB UNLESS you got the bias in your favour anticipating the reversals. Very hard, very risky. Each reversal was worth around 20 - 30 points peak to peak. Take off that some "dither time" and you end up with 10-15 points. Instant loss trade on the spreads alone . Chase your tail here and you're looking at SEVERAL losing trades on the trot, each worth 10 - 20 points. That will easily wipe out ANY gains you may have made today- 100- 120 points.
 

Attachments

  • dow 08-05-03 1 mina.gif
    dow 08-05-03 1 mina.gif
    22.5 KB · Views: 414
Top