Brave attemt, but not enough. I'm always a day early so Monday will see a close at 8669. 🙂
Last night's look at ES turned out to be correct- a good up day today. As it happens, the dow 10 min chart told a similar story....
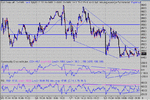
I've included recent channel lines so you can really appreciate that they ARE important, once they are established. In this case, 8510, 8550 and 8580, the latter going back to 2nd May.
Natural support and resistance numbers ( 32 and 64) came into play today. Two targets to get the day off to a good start, T1 and T2 the second being the rusult of the reverse triangle. That was testing new highs at 8600 and a strong blocking point. Now the price dithers around , deciding, before dropping to 8570. Note the weakness in RSI/Price on this drop. Hardly surprising then, that it quickly shot back up to support at 8580. Unusually two RS switches today, the second one failing almost immediately.
Finally a channel ride up into the close, which should lead to a continuation on Monday...... Or is it a tripple top and drop?
70- 100 points on the table today...
As yesterday, trying to trade the latter session may have eaten up all your early gains. 🙁