You are using an out of date browser. It may not display this or other websites correctly.
You should upgrade or use an alternative browser.
You should upgrade or use an alternative browser.
Interesting Point there TS - I thought there was some "witching" going on. Too much argy bargy for a Friday afternoon I was thinking.
Now where's my "wizards" hat - I really don't need to see into the future, all I require is a sharpened pencil with "witch" I can note certain dates in my diary! 🙄
Q
Now where's my "wizards" hat - I really don't need to see into the future, all I require is a sharpened pencil with "witch" I can note certain dates in my diary! 🙄
Q
A bit more volatility today, but not too easy to capitalise.No clear 32 or 64 breaks, no clear nd's and just the nd towards the close.I guess the open DB at 990 would have been a good entry, but that bull flag went a long way down before turning round and the false drop to 9905 would have spooked out most....
Attachments
Bill
Active member
- Messages
- 160
- Likes
- 1
CM
Ah yes but it needed a quick bounce from 100ema -15 didn't it............. have a look
Oops ! forgot I'm not posting ATM 😱
Bill 🙂
and the false drop to 9905 would have spooked out most....
Ah yes but it needed a quick bounce from 100ema -15 didn't it............. have a look
Oops ! forgot I'm not posting ATM 😱
Bill 🙂
Attachments
TraderTony
Active member
- Messages
- 180
- Likes
- 1
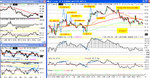
Only a half day today for me as away for weekend but a quick glance at the closing charts suggests only one more clear entry for a small win at best.... Will post charts when back on Monday.
9:51: 1) S 9903 just after Michigan sentiment. Moved nicely to gap close then choppy.
9:58 EXIT: +6 (+15 at peak)
10:15: 2) L 9925. Feels like I'm chasing here. Moved up a bit but no follow through. Not liking this one at all. Has to break about 30 level but looks unlikely.
10:21: EXIT -4 (+4 at peak). Then it turns right round again and takes out the high. How annoying is that.
10:27: 3) L 9927. 3m chart is really timing these early entries badly. I hate this entry even more than the last one. Straight into loss. Then a pop into profit but fails at previous high (+6). And again. Come on. Looks dead on last failure. The 1 tick through but no momentum.
10:33: EXIT b/e (+7 at peak).
Getting in too late on these entries and playing the sucker. Now I'm going to take another one. Arghh.
10:39: 4) L 9933. This is ugly. Chasing every entry when there is no follow through. Not good at all.
10:40: Straight out -7. And I knew it would be too. Never in profit.
10:57: 5) L 9921. Here we go again. At least pulling up off 100 ema this time, but again I feel I'm chasing. Jumps into profit but no follow through again. Ugly 45 minutes for me with high number of entries triggered but all duff.
11:03: EXIT -1. (+5 at peak).
Interestingly, 10m CCI has been been pulling back to zero line with higher highs all morning (= stay out?).
100 and 34 emas completely flat lining here so sitting out could be best option until some clear movement again...
But I keep on trading!
11:18: 6) L 9917. Horrible. Straight to stop.
11:18: EXIT - 4.
11:54: 7) L 9913. I shouldn't be trading here.
11:55: EXIT -4.
I really should be sitting out until there is some clear movement here.
12:03 Possible break back to downside. Or not. Then possible break to upside.
12:21: 8) L 9934. Hoping this is the breakout. Up nicely then ugly reversal bar.
12:30: EXIT +12 (+20 at peak).
12:42: 9) L 9954. No follow through at HOD. Urgh. ND on CCI. Another loser coming up. Come on this is rubbish. Then into profit a little but nothing locked in.
12:55: EXIT -1.
Had to leave there.
-3 from 9
-12 for day after commissions
+139 for October so far after commissions.
Attachments
Last edited:
TraderTony
Active member
- Messages
- 180
- Likes
- 1
Bill -
Just wanted to say I hope you keep posting as you work on your system - I find your insights very interesting and I am starting to find the +/- 15 envelope on the 100 ema very useful.
Good weekend to all,
T
Just wanted to say I hope you keep posting as you work on your system - I find your insights very interesting and I am starting to find the +/- 15 envelope on the 100 ema very useful.
Good weekend to all,
T
Bill
Active member
- Messages
- 160
- Likes
- 1
TTony
Thanks for the vote of confidence Tony. You haven't seen tje last of me by any means. I just need to do a few weeks work on an addition to my strategy. It probably means I will be making some rather strange and apparently sucidical trades which are of no interest to this BB. All the ideas are a bit 'half-baked' atm but roughly speaking they are as follows.
1. The 15 ema channel works fine on a sideways day but how can I find out what is sideways?
2. When sentiment changes mid session can that be detected?
3. Is it possible to combine daily/weekly trading with intraday using SB. Could the clue to daily sentilment lie in the bigger picture?
4. I may create a website showing how this strategy works. Available to anyone who cares to look [Not for profit Sharkey/CM if you read this].
5. I have often thought of designing a training facility whereby the user can select a set of intraday data and replay it in a chart in order to practice their trading skills. It would have stop forward reverse slow and fast data delievry speeds and a random [unknown] selection of dates. That might take some time though.
One caveat. On the right kind of day I'm very happy with the standard Dow strategy.
I hope you keep on posting Tony. I particularly like the honesty. It is unusual to find someone with the guts to post when things didn't go to plan. The benefit though is that when you do make a profit there is very little doubt that it is genuine.
Regards
Bill 🙂
T
triplepack
Hi Bill ,
I was following some of your posts regarding the channels, your comment in last post how to determine a sideways day and utilise ur strat., I was reading through NQoos site on a Joe Ross article, The gimme bar. he uses bollinger bands and as you no doubt have noticed that as the volatility of the price reduces the bands narrow and u can see them kink over downwards and upwards . this may give u a clue for the forthcoming period . he also uses the gimme bar which is a reversal pattern and manages the trade to either the 20ma or the other bb. might be worth a look for those quiet ranging days.
cheers
Triplepack
Trust me Bill, original research proves often to be the most fruitful even though it may not be the holy grail. The one single thing you will get over everyone else is that you alone will know 100% how it works and what the rules are and how to make the most of it. I wish you a successful journey. I take it you may be gone for a while...... :cheesy: :cheesy:
Bill
Active member
- Messages
- 160
- Likes
- 1
Triplepack
Thanks for that. I have looked at Bollinger but it was about 2 or more years ago. I might take another look.
CM
You make it sound like I'm joining te foreign legion. You do that to forget don't you? ...
Now then what was I taking about?.... Oh yes. I'm really happy with the 15 channel and just to put it in perspective I opened the CapitalSpreads demo account maybe 4 months ago to have a go at FX. It was a disaster and I lost loads of virtual money. The message is stick with what you know i.e. Dow. Over the few weeks I've been posting I have managed to bring the account back up to it's starting value. As of this week it has just crept over the £10k mark again. I'm really pleased with that and want to build on the success but to do that I really need to bring my batting average up. Soon as I've got something to show I'll start posting charts again but in the meantime I'll confine my responses to the general chatter. Like TSmart's shed and people who climb walls 🙂
Bill
Attachments

Chartman said:
I have attached a chart of the triangle on the daily chart, any comments more than welcome.
It appears to have a mouth of 650 points if you take the mouth at "A" or at "B" the mouth is 450.
So would the target be the breakout point at "C" (10069) minus the mouth? If so this would be around 9400 (or if the mouth is 450 then the target would be 9600.)
If the optimum time to hit the target is the apex of the triangle then we should get there around about the 26th Oct.
Justyn.
This could develop into a Bear flag, with a 200 point pole...On the other hand, it may not
I have attached a chart of the triangle on the daily chart, any comments more than welcome.
It appears to have a mouth of 650 points if you take the mouth at "A" or at "B" the mouth is 450.
So would the target be the breakout point at "C" (10069) minus the mouth? If so this would be around 9400 (or if the mouth is 450 then the target would be 9600.)
If the optimum time to hit the target is the apex of the triangle then we should get there around about the 26th Oct.
Justyn.
Attachments
as a newbie - just one question -
Are you trading the index or individual stocks in the DOW30? Why I ask? This index is the easiest to manipulate. TRAN as a part is a big joke at the moment with airlines filing for Chapter11 in a never ending row. I try to follow M3 to get a hint in which direction they are going to make the daily moves. SPX is a bit easier but nothing is easy in a manipulated world as the stock market. MSFT, INTC, IBM are among the heavy stocks they use to pull the indexes in either direction.
Are you trading the index or individual stocks in the DOW30? Why I ask? This index is the easiest to manipulate. TRAN as a part is a big joke at the moment with airlines filing for Chapter11 in a never ending row. I try to follow M3 to get a hint in which direction they are going to make the daily moves. SPX is a bit easier but nothing is easy in a manipulated world as the stock market. MSFT, INTC, IBM are among the heavy stocks they use to pull the indexes in either direction.
Bill
Active member
- Messages
- 160
- Likes
- 1
maxpain
If you are not comfortable with Dow trading then the best advice I could give is stay as far away from it as you possibly can. Look for something you feel at ease with, maybe FX? Since it has very good liquidity. I do know there are some extremely competent traders posting on the FX thread if you need guidance.
Hope that helps
Bill 🙂
If you've read any of the posts on this thread then you will realise it is the Dow cash/futures.Are you trading the index or individual stocks in the DOW30?
If you are not comfortable with Dow trading then the best advice I could give is stay as far away from it as you possibly can. Look for something you feel at ease with, maybe FX? Since it has very good liquidity. I do know there are some extremely competent traders posting on the FX thread if you need guidance.
Hope that helps
Bill 🙂
Bill said:maxpain
If you've read any of the posts on this thread then you will realise it is the Dow cash/futures.
If you are not comfortable with Dow trading then the best advice I could give is stay as far away from it as you possibly can. Look for something you feel at ease with, maybe FX? Since it has very good liquidity. I do know there are some extremely competent traders posting on the FX thread if you need guidance.
Hope that helps
Bill 🙂
Hey, only asking if it´s allowed - see stocks move indexes if you didn´t know?!!
Similar threads
- Replies
- 0
- Views
- 2K
- Replies
- 10
- Views
- 6K