Dow Intraday Charts 11 Oct - 15 Oct

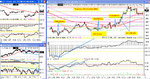
Here's the plan of where the cash is, you just need the location.

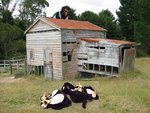
The cows like it CM…….I just have to watch that they’re not grazing on £10 notes….

Whoops….!!…..there’s just been a huge gust of wind and a crash – I’d better go and check…….. :(

ps - the captions are remarkably accurate......how did you know....?!!..... :cheesy:
 
TS

I bought a house just like that in the eighties. A Barratt home. Even 'Challenge Anika' wouldn't take it on. Not in Hertfordshire is it?

Bill :)
 
Tuesday 12th October 2004

Chasing shadows for most of the day looking for shorts as the market kept pulling back from the gap down. Finally got one right at the end. Perhaps a clue to the frustrating action most of the day was that (as yesterday) the CCI on the 10m was pulling consistently back towards the zero line.

10:03 1) S 10018. Risky as looking for more follow through in direction of the gap. Moves in favour (+8) then reverses sharply with potential PD.
10:17 EXIT: +1 on taking out high of previous bar.

12:48 2) S 10027. Could be a breakdown.
12:54 EXIT: -1. Or maybe not. Frustrating.

14:00 3) S 10040. Ditto. But again no follow through. I'm getting suckered into these.
14:06 EXIT: -2.

14:24 4) L 10056. Finally broken above the CCI zero line, above the HOD, so going long but it could just be another fake out. Moving very nicely at last though.
15:09 EXIT: +30. Ran over 40 into profit at its peak but I'm happy to get 30 after another frustrating few hours.

+28 from 4
+24 for the day after commissions.
+33 so far for October after commissions.
 

Attachments

  • 20041012.jpg
    20041012.jpg
    296.1 KB · Views: 188
Hi all,

I have been on the thread for a while but don't always get time to post my trades due to work and stuff. But one thing I must say is that Chartman deserves the nobel prize for the discovery of 32,64, it has helped and saveed me quite a few times since I 've been on this board.

Thanks

Sall
 
According to Esignal CCI hit around -1000 at the open yesterday. When it's that low quite often the only way is up.

The other clue was the divergence at "A" attached.

TradeSmart's triangle is still developing and plenty of room on 10 min CCI & RSI so maybe we'll see 10200 today.

I burnt my fingers yesterday, had to dash out unexpectedly about 17:00 and was in a long position. Decided to set a stop at 10000 but accidentally set a LMT SELL order not a STP. The result .... the order was actioned as a sell straight away at 10028 (a loss) and when I got home later we were approaching 10090 so I was well annoyed :(

Good luck everyone today!

Justyn.
 

Attachments

  • chart.gif
    chart.gif
    14 KB · Views: 187
Don't listen to what TradeSmart tells you about his shed.

Here we can see the truth ... the evil Giant TS peering down at some of the poor penguins he has been keeping in cramped conditions.
 

Attachments

  • shed.jpg
    shed.jpg
    51.5 KB · Views: 214
Hey Justyn.........!!!!!!!!!

You've discovered the location.......

I demand that you take the webcam down........!!!!!!!!!!!!!!!!!


;)

(the RSPCA might be looking in....)
 
Last edited:
I have discovered all this stuff about sheds and penguins is secret code for 'those in the know' about the Dow market action for the coming day. Incredible!

If I've got it right, it's unlikely to go above 10,300 or below 10,000 - unless it does.

Am I right?
 
There's that old '64 creeping in again.

Well, I remain impressed with your bravery in committing to a range. I'll be even more so if it's close!
 
Well, I remain impressed with your bravery in committing to a range. I'll be even more so if it's close!

Looked close for about 10 mins, but '13' (Oct 13th that is..) has proved stronger than '64' (and 32 and 10000......)

This calls for another 'guess' trend channel - 9900 ish coming soon........?!........ :confused:

edit - however, there are still some optimists about.......

Not unlike Wagner's music, which has been said to be better than it sounds, "the market is not acting as bad as it looks, [because] there are many pockets of strength", according to Todd Leone, head of listed trading at SG Cowen.

:LOL: :cheesy: :LOL:

but what about Jimi Hendrix.........???
 

Attachments

  • 13-10-04.gif
    13-10-04.gif
    19.1 KB · Views: 230
Last edited:
Hi

Well that was much better! Not a day for the channel rules so standard stuff only today.

Long @ A just after 5:0pm when I got home from work from an expected bounce from 32. The bear flag shown began to appear so this trade looked increasingly suspect. I was very glad to close it for BE and took a short as the flag broke.

This is where I need help. Can you see my calculation of T1 is derived from the little bear flag/pennant after 3:30pm. I therefore ended up with a target just above 10k which I was happy to take for +27. But this was not the end of course. So the question is this


1. Without the use of hindsight is this the right way to calculate the target?
2. Again no hindsight, should I have looked for a secondary target, assuming [1] was right?
3. The third alternative was to use the 3:00pm peak-to-flag distance to find the target, which would have worked I suppose.


Anyway to continue the story... E was taken from PD and near to 64 and it's close as 10k was re-tested for +23 which made a nifty fifty.

Happy boy today +50 :)

Regards

Bill

PS Early finish - don't want to spoil it !
 

Attachments

  • dow_131004.gif
    dow_131004.gif
    31.8 KB · Views: 221
Wednesday 13th October 2004

Missed all the early action which is the really frustrating thing about the 3m time frame. Not decided yet which works best for me. I have adjusted the CCI to 100 to fit better with the action of the 100 ema, which still seems to do well in this time frame. Having said that, today went on to work out beautifully - the losers were small and limited and the winners ran well. If only everyday was as nice!

10:54: 1) S 10061. Hoping for more downside after a flag just below the 100 ema. Moves very well! +25 before first high of previous bar broken, +33 at peak.
11:27 EXIT: +24 on taking out previous swing high.

11:48: 2) S 10030. Looks like the party might be over, at least for a while.
11:51 EXIT: -3 on taking out high of entry bar.

12:06: 3) S 10031. Still taking the signals but getting very flat here with PD.
12:09 EXIT: -1. Taking out high of previous bar. Could have been premature but it is just chopping again now.

12:57: 4) S 10036. Difficult to know whether to stand aside or keep taking the signals on lower highs on CCI. Still range bound but below down sloping 100 ema.
13:02 EXIT: -2.

13:18: 5) S 10029. Looking for a breakdown here. Wow! That's sweet. Moving really well and cuts straight through the 10000 level.
13:02 EXIT: +47. Went to +57 at peak.

13:51: 6) S 9964. Probably out of the last one too easily (wanted to pocket the profits) as right back in now but 15 odd points lower down. Moves a little after quiet first bar but bouncing off 50 level. That could be that.
14:06 EXIT: +5 after hitting +13 at the 9950 level. Sharp and frustrating reversal.

15:21: 7) S 9978 for another move down. Hits +13 at peak then a nasty looking reversal.
15:30 EXIT: +4

OK, into the last 30 minutes and I'll call it quits there.

+74 from 7
+67 for the day after commissions.
+110 for October so far after commissions.
 

Attachments

  • 20041013.jpg
    20041013.jpg
    290.8 KB · Views: 230
Bill well done you bagged a nice few points there.

The attached chart shows how you arrive at 60 as the target for the flag. Always difficult at the time and easy to "make it fit" with hindsight - where do you take the flagpole as starting from?

Failure to make 32 at the open along with the weak second push up reflected by RSI (point "A")was the clue to go short. And the 3 pk divergence at "B" was the place to get out and see what happened over lunchtime.

The bear flag at "C" gave a target of 060.

Well oversold at "D" both on 1 min RSI and CCI so if you held out for 60 you knew if wasn't going to go any lower than that - and a big divergence on those two lows at the bottom.

Glad everyone (so far) had a good day :)

Justyn.
 

Attachments

  • chart.gif
    chart.gif
    21.3 KB · Views: 243
TradeSmart's triangle broke with vengence after failing to get up to resistance at the open .... as indicated by the Doji Falling Rising Random Penguin pattern posted earlier :LOL:

Looking at the divergence and low RSI/CCI I'd say we will see a pullback to the triangle support at 10032 before we head South, unless this pullback to 10000 is all we're going to get. Lots of news due out next 2 days.

Could be wrong as always, will check the Shed-Cam tomorrow for new penguin patterns. :cheesy:
 

Attachments

  • chart.gif
    chart.gif
    21.7 KB · Views: 239
Last edited:
Thanks for that Justyn. I though that's what might be said. I think I am confusing the measured move pattern where you measure the uninterrupted length of the pole to find the target. Help with distinguishing measured move calculations from this type of target calculation would also help.

TIA

Bill
 
Bill no worries, I'll explain how I saw it develop:

If you look at the attached chart there were 4 down moves of 30 points, each with a 10 point pullback.

I'm no expert on EW but I find looking for these waves useful. Sometimes you can see the price move down say 30 points and when it pulls back 10 or 15 the RSI has moved up a lot to give room for the next 30 down. Sometimes the waves have 2 pushes down sometimes 3,4 or 5.

I find if you combine this with looking at what RSI and CCI and NYSE Tick are doing you can normally predict whether there is another push coming.

I got out after the third push down today (should have waited for the 3 pk bottom) but I had to go out so was happy.

HTH

Justyn.
 

Attachments

  • chart.gif
    chart.gif
    15.3 KB · Views: 226
Great going guys- 50 and 100 for the month for Tony. Sall, 32 and 64 ain't rocket science- it's 2 raised to the power 5 and 6 ( or is it 4and 5, or 6 and 7 even? :cheesy: )
The elliott waves are good when there's a strong move- you can count on 5 or 7 legs down.....
I'll show you the bear flag on the one min- I made it 80 for the pole....
The channel is there- but not well defined due to the violence of the moves, hence some overshoot.....
 

Attachments

  • dow 13-10-04 10.gif
    dow 13-10-04 10.gif
    35.4 KB · Views: 236
Quick couple of points... RSI strength for Sall. The Pole for the bear flag is 80. CCI well into OS then divergence, but NOT the bottom on CCI - 600.
Pullbacks only 10 points- given the drops, they were minimal, showing the potential depth of the drop.Even the bear flag only pulled 20 or so...
Maybe we can hold on to 10 K tomorrow.
 

Attachments

  • dow 13-10-04 1.gif
    dow 13-10-04 1.gif
    26 KB · Views: 256
Top