Dow Intraday Charts 11 Oct - 15 Oct

CM - looking at the longer timeframe, is there any indication of it testing the 9800 level? I'm not a classical chart patterns type so may well be reading it incorrectly, but it looks like a double top just formed?
 
Pass.... My Sierrra can't connect to MyTrack from my office. Something has gone wrong and I don't know where the problem is....
 
ChartMan said:
Pass.... My Sierrra can't connect to MyTrack from my office. Something has gone wrong and I don't know where the problem is....

probably a firewall issue, you can pm me if you like and i'll see if i can help....

dan.
 
RSI PD on the 60min chart, and in other timeframes suggests that we may be plumbing a short term bottom - let's see.........?!......... :confused:
 

Attachments

  • 14-10-04.gif
    14-10-04.gif
    16.6 KB · Views: 199
ChartMan said:
I think a "W" will form, but I have no charts....

Problem with Sierra solved. Had to switch off my router, then back on and sierra connects fine now.
 
That's better! For the "W" this has to be the bottom, but the target would only be 10,032... Seems to me to be plenty of room for more downside...
A PD bottom+ bull flag? maybe, but again this will have to be the bottom and target is 10,020...
1 min chart well OS on RSI
 
Hmmm - Still plumbing the bottom and PD building up, but US lunchtime approaching and a possible liquidity drought.....

9910 ish has provided good support before and is around the 4hr channel bottom....

Oil north of $54, and if stocks make a mild foray north, it could be after NYMEX closes at 19.30bst....

But maybe oil will suddenly fall and they won't go to lunch.....!

Speculation.......speculation....... :p

Edit – daily chart attached – the break out down from the big triangle is plainly very bearish – I note that on previous significant rallies PD has occurred on both RSI and CCI – CCI is currently pointing decidedly down…… :confused:
 

Attachments

  • 14-10-04a.gif
    14-10-04a.gif
    21 KB · Views: 212
  • 14-10-04b.gif
    14-10-04b.gif
    19.7 KB · Views: 202
Last edited:
CM many Thanks for indicating RSI stuff, makes it a lot clearer, 32, 64 magic indeed....
 
Thursday 14th October 2004

Great morning - really frustrating afternoon.

9:48: 1) S 9978. Not looking good straight after entry and goes to 1 tick from stop. Then turns round and into a small profit but no follow through. Hits +15 at maximum before pulling right back without much profit locked in (trailing 1 tick above high of previous bar).
10:03: EXIT +7.

10:12: 2) S 9970. Springs straight into loss. Ugly.
10:18: EXIT -3.

10:51: 3) S 9966. Again moves straight into loss but then back into profit and down to take out yesterday's LOD. Then price holds right at yesterday's LOD. Then down some more. Nice. Maximum profit potential +34 at peak.
11:14: EXIT +26.

11:24: 4) S 9943. Marginal entry and this time taken straight out. In fact there never actually was an entry on the CCI.
11:25: EXIT -6.

11:36: 5) S 9943. Try again on a clearer signal. Running well again to new lows. Hit +30 at 9912 then pulled back really sharply potentially giving back a huge amount of this move. Then stalls completely. Then another push to new low but potential PD on the CCI here.
12:09: EXIT +29 (hit +38 at peak).

12:54: 6) S 9916. No follow through after entry - gone flat. Then pulled to +10 right at previous LOD. Stalls then breaks through and rebounds hard off 9900 level. +17 at peak but reversing sharp and hard. 9900 would have been a very good exit.
13:03: EXIT +3. Very annoying - gave back far far too much. Big reversal bar with huge PD now on CCI.

13:09: 7) S 9907. Try again. Small follow through but no momentum.
13:15: EXIT -1. Possibly premature as it hit new lows on the next bar. +7 at peak.

We've had big PD on 3m and 10m CCI now.

14:36: 8) S 9896. Very slow here with lots of divergence at the 9900 level. Not hopeful about this one. Struggled to two ticks profit then into loss.
14:40: EXIT -4. Damn.

14:45: 9) S 9892. Reluctantly back in again straight away. Pulled down nicely this time. Needs to follow through and it isn't - straight back towards entry and into loss.. Horrible series of trades. 9900 level is just messing all these further attempts to go short and the profit from this morning is getting chomped up. Frustrating.
14:49: EXIT -5.

Missed the next move which finally went somewhere again.

15:12: 10) S 9883. This looks like another doomed trade right from the outset. I really don't like this choppy action here and should probably keep out for the rest of the day. Pulled to new LOD but no follow through and expecting another sharp reversal any moment. Hit +9 and boom - back up again. Then hit +13 and up.
15:21: EXIT +5. Gave too much back again.

OK - into the last 30 minutes and I'll call it quits there. Still a good day overall - I love it when it moves!! Longer time frames suggest at least a temporary bottom may be in.

+51 from 10
+41 for day after commissions
+151 for October so far after commissions
 

Attachments

  • 20041014.jpg
    20041014.jpg
    285.3 KB · Views: 212
Hi

Got it wrong again. Channel rules no use today so I was looking for normal TA. I took a silly long @ 9919 from PD which stopped for -23. Real-time I could not figure out what was going on and could not stop myself from looking for a price bottom, hence the trade. Looking back though I think there was a lot of information. I've annotated the chart with what looks like a series of bear flags together with targets which were met. The only reason I can see for not noticing them is that the flags themselves were rather steep and not what I'm used to.

Well another lesson learnt ! -23 today.

Nice one TTony BTW

I'm going to stop posting for a while whilst I do a bit more homework.


Regards

Bill :)
 

Attachments

  • dow_141004.gif
    dow_141004.gif
    25.9 KB · Views: 204
I stand corrected about the channel, noted by Bill yesterday.... What Channel? :eek:
Looks like a bottomless pit right now.
 

Attachments

  • dow 14-10-04 10.gif
    dow 14-10-04 10.gif
    36.8 KB · Views: 225
Plenty of non delivering PD's.... Three attempts at recovering 10K should have signalled what was to come..... a ride under the 100MA for the whole day- just.
 

Attachments

  • dow 14-10-04 1.gif
    dow 14-10-04 1.gif
    25.5 KB · Views: 215
EW / MV comments re. Dow

Hi Guys,
I've tried to post a couple of times this week but each time lost the "diatribe" somewhere in the ether.
Weekly results so far are not bad +455/+447/ +59/+415; average 336 weekly.

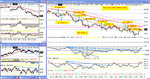
And now to the bad news ... what a week. A picture paints a thousand words so see enclosed hourly chart. Basically I've been collecting longs from 10050 downwards; now fully exposed and underwater by 983 points ... actually, this week I closed profitable shorts for 302.5, so I'm down net 680 points.

I hate this honesty lark, much too painful:)

Anyway I take a contrarian stance and it's being tested AGAIN. Can my coronary arteries take much more?

EW reckon we've just finished an ending diagonal C wave. If so upside could go anywhere from 10120 to 10270. If the ed hasn't finished yet, then 9800 is possible on the downside. The hourly / daily triangle is now excluded but upside is still likely. The question is how much. We're either going to correct this wave down and morph into a wider and deeper down pattern OR we'll start a new Big C wave up. Either way, it's up from here .... at least I think it will be:)

EWI, as always, reckon we've just finished wave 1 of the big 3 down. They're looking for a correction to at least 10120 and max 10270. Of course, they might change their minds once we get up there. If the next leg up is impulsive, the Big C wave becomes the favoured pattern. We'll see.

MarketVolume see loads of supportive volume which has corrected the resistive volume which triggered this down leg. Their medium to long term forecast remains bullish. Downside minimal from here in their opinion.

So, might need Scuba gear for a downside risk to around the last higher degree low at 9780. On the plus side we've just completed an A=C (within the lagelled Big B wave) at 9880, which gives firm support at exactly 9878 if my eyesight is right.

Good luck trading today to everyone. I'm standing back and watching the medium term from here but as always might get tempted with a small in/out or two:)

Regards,

Graham
 

Attachments

  • hourly.gif
    hourly.gif
    119 KB · Views: 205
havent noticed this amount of variation before!!
The Dow is at around 9935 ( 14:40 ).
The D4F cash is 9903-9908, and DowDec future at 9891-9899.
 
TheBramble said:
Trendie, have you tried getting anything on at those levels?

If I wanted to BUY, I would have !! ( 30+ points bargain )
But the main trend is down, I am only looking to SELL.
If the D4F price had shown as 9945, I would have taken a cheap SELL !!
 
Well, a good ‘guess’ trendline never lets you down and 9900 wasn’t far out:-
http://www.trade2win.com/boards/showpost.php?p=133539&postcount=32

I suspect that the foray north today is just triple-witching Friday bounce that will soon collapse to equal or exceed the recent lows, with the possibility of forming a short term ‘bottom’…………..

It all seems to hinge on the price of the crude black stuff……. :confused:

Greenspan’s speech….

He also rejected theories that the world will soon run out of oil

Oh good……!…..... :cheesy:
 

Attachments

  • 15-10-04.gif
    15-10-04.gif
    18.6 KB · Views: 205
Temporary respite, as TS suggests. This could develop into a Bear flag, with a 200 point pole...On the other hand, it may not. :cheesy:
 

Attachments

  • dow 15-10-04 10.gif
    dow 15-10-04 10.gif
    38 KB · Views: 218
Top