You are using an out of date browser. It may not display this or other websites correctly.
You should upgrade or use an alternative browser.
You should upgrade or use an alternative browser.
welshwarrior
Junior member
- Messages
- 16
- Likes
- 0
Hi Chartman,
Hope all is fixed soon with your PC. Thanks for an excellent thread BTW - hope you are back soon!
Hope all is fixed soon with your PC. Thanks for an excellent thread BTW - hope you are back soon!
rossored
Senior member
- Messages
- 2,103
- Likes
- 56
CM, I remember you and BB making a comment in the chatroom the other day about using volume to confirm either a PD bottom or ND top, but didnt totally grasp what you were saying at the time. Can someone explain to me the correlation between the two, and how this might indicate confirmation of a reversal?
Cheers,
Matt
Cheers,
Matt
After much stress with the PC I'm back up and running. At least some unexplained problems are now solved for good measure. A rash trade late on cost me a few points as the price broke through 64 at 20:12..... At RSI 20 and LOD for RSI it looked a fair trade... With such a tight range and no real opportunities, least said the better... Even the triangle break at 17:46 only delivered 20 points + the ND top, barely worth the bias, but you don't know that at the time..... Well you did actually, with RSI going from 20 to 80 for 30 points... It wasn't going anywhere exciting....
Attachments
F
ford
F
ford
I just deleted my ES`U file and downloaded a fresh one from MyTrack, all is fine now.. Not happy that it happened, it's unacceptable when money is at stake. 😕
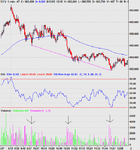
Just a quick re-cap on the 15 min chart. Either the ND will come into effect or we'll break out of the channel.Currently sitting just below mid channel. 9250 for the drop, 9350 + for the break.
Strange goings on after hours may screw this right up. S&P dropped nearly 15 points, recovering to down 8 from the close. That takes us just below 9250 on the DOW ( estimate as I don't have DOW futures)...The overnight action will tell......
Strange goings on after hours may screw this right up. S&P dropped nearly 15 points, recovering to down 8 from the close. That takes us just below 9250 on the DOW ( estimate as I don't have DOW futures)...The overnight action will tell......
Attachments
temporarilylight
Established member
- Messages
- 531
- Likes
- 60
lol...i like the way u put it chartman...'strange goings on after hours could screw this right up...' This kind of action annoys me. Messes up my charts aswell,,,,we'll see how we open 2morrow i guess.
Good day, if you walked away at tea time like I did.... having taken a quick 4.2 points on ES.. I missed the bottom though, as well as the magic 32, but got in on the 64 break. That's how it was supposed to be last night with my flash 1 point stop 🙂 Got out on the first little pullback at 9330, just a tad early, but that's no problem. It looked reasonably strong here so I didn't even think about a short. The Bush Speech seems to have given the MM's an open book to move the market like a yo-yo! Down first, to shake the longs out, then up to shake the shorters as Bush Started. Only 30 odd points though.
That drop after the 3rd peak was 40 odd points for a 66 point move in RSI, telling me that the drop was weak..... Then whipsaw city whilst the market waited for the Bush Chat, I guess. A great example of why not to enter a trade, as the price closely follows the 100MA and goes nowhere. IF you must, it is mandatory to place a stop at the 100MA +20 or - 20, AND stay in the trade you took until you either get stopped out, or the trade breaks in your favour. This tracking rarely drifts up or down with any significance, EXCEPT when it's going to break, one way or the other. Entering at anywhen after 17:30 would mean you would have stayed with that trade until the close, making or losing just a few points....
That drop after the 3rd peak was 40 odd points for a 66 point move in RSI, telling me that the drop was weak..... Then whipsaw city whilst the market waited for the Bush Chat, I guess. A great example of why not to enter a trade, as the price closely follows the 100MA and goes nowhere. IF you must, it is mandatory to place a stop at the 100MA +20 or - 20, AND stay in the trade you took until you either get stopped out, or the trade breaks in your favour. This tracking rarely drifts up or down with any significance, EXCEPT when it's going to break, one way or the other. Entering at anywhen after 17:30 would mean you would have stayed with that trade until the close, making or losing just a few points....
Attachments
Yes, strange as in it's not normal to see such violent moves after hours, even if a company puts out a bad result... One tick on ES went from 980.8 down to 973.3 Now just 6 points off the close... Maybe it was scaremongering over the power cuts in the USA. Listening to CNN and watching the charts just now, there was a guy stressing " No Terrorist event " responsible, caused an immediate 3 point rise in ES.Maybe we'll be back to normal by the morning.
Thanks,
Apart frm the divergence at the open and the duration(0.5hr... what do you mean by their interpretation?
Taking action on divergences ( especially PD) is a tricky excercise if taken from the open. They do not conform to the normal rules.
And my q. on the time to realisation was ref. to the 1min chart ?
On the 1 min chart, there must be at least 25 minutes between 3 peaks to be a valid top or bottom. Less than that, it is likely to be just a minor correction.
And if you can answer "...And is there more probabilty of realisation under any specific time chart?.."
Yes, in the 1 minute chart, 3 peak pos and Neg divergences produce highly predictable results. However, when you look at the 10/15 min charts, they are far less predictive and hence cannot be relied upon to deliver a result within a specific time frame..... we're talking hours.....to a day or two.
Chartman, i wanted to ask something about the Day Trading the Dow strategy please. The chart settings refer to 1-minute charts for DJI..now if i am trading the Dow(YM) future with IB..will this refer to the future chart(Ym) or the cash chart. I would think it would be the futures chart but i wanted to be sure.
Please could you confirm this!
nb - i have been paper trading your strategy on cash chart & i think it's Brilliant.
thanks
Sonny
Please could you confirm this!
nb - i have been paper trading your strategy on cash chart & i think it's Brilliant.
thanks
Sonny
If you're going to trade the DOW futs, you must use the futures chart. But, and others may well chip in, I think ES futures will be more tradable..... Personally I can't stand the DOW futures chats as the are just full of spikes, clouding the picture. You may find that it is better to do your TA off the cash chart, and time your entry off the futures chart.