You are using an out of date browser. It may not display this or other websites correctly.
You should upgrade or use an alternative browser.
You should upgrade or use an alternative browser.
tradesmart
Experienced member
- Messages
- 1,286
- Likes
- 22
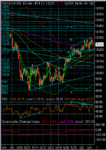
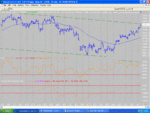
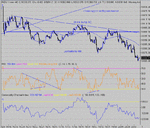
ND over 8 days showing on the 60 min chart and we’re very close to the 50% fib retracement point of 10750 – 9850 move…..could be a pullback in store shortly.....
However, futs now north of 10310, so a good ‘pop’ assured at the open…..!
(pop'n'drop........!?)
However, futs now north of 10310, so a good ‘pop’ assured at the open…..!
(pop'n'drop........!?)
Attachments
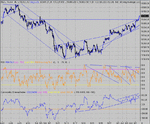
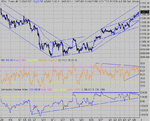
Possible pop n fly. 🙂 I did say Friday that the price had come off the RS Switch. So why did the 60 min ND do nothing.? There comes a point in divergence where the RSI channel no longer represents a divergence, but rather a "re-basing", allowing room for the price to continue, as today. How can you tell the difference? I'm not sure you can. In any case, after today's rise, we'll either consolidate or drop. Would a drop constitute the divergence delivering? Only if we drop below 250 and start a down trend. We're not far off the 500 top, with only 100 odd to go, but with RSI and CCI topped out, getting there tomorrow will be a tall order. It needs a pullback and RSI to drop to give room to move to 500+.
Attachments
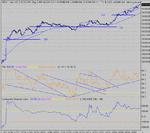
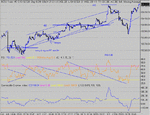
One of those days where if you are preconditioned into thinking down, you're gonna get your but kicked, time and again. One possible place for thinking down was as the price dropped 332 under the 100MA..... but a quick look at RSI that dropped from 70 to 30 for a 20 odd points drop should have kept your finger off the sell button. In at 300 and out at the end, with max pullback mid day of 22 points... Not my sort of day with a total lack of targets for guidance...
Attachments
Hi CM,
Just adding another couple of charts (longer term) to complete the overall picture of resistance overhead,
Got very close to the 3rd knock on the downward channel on the daily chart
Also, as tradesmart has pointed out earlier, got ND on the 60 min chart.....seems close to completing (ed) 3pk ND???
Just adding another couple of charts (longer term) to complete the overall picture of resistance overhead,
Got very close to the 3rd knock on the downward channel on the daily chart
Also, as tradesmart has pointed out earlier, got ND on the 60 min chart.....seems close to completing (ed) 3pk ND???
Attachments
tradesmart
Experienced member
- Messages
- 1,286
- Likes
- 22
It appears that the plan has come together……!
An immediate pullback this evening at 10432 (thanks CM!... :cheesy: ) as if the objective had been achieved – also near the junction of two major resistance trendlines and as near as dammit a 61.8% retracement of the 10750 – 9850 move…….
RSI at the top of the recent range…...
A decision point………..?!......... 😕
edit: 20.57 - down for a 61.8% retracement of the day's move and then up to test 430 again - Fibonacci knew a thing or two... 😉
Attachments
Last edited:
TS I'm not knocking Fibbs, but just consider this. You took 10,734 as the 100% and 9909 as the 0%. Why ???? What if you take the last reaction high at 10,571 ? Why would one choice be more correct than another? Does anyone have enough depth of knowledge of Fibs to give an answer?
As it turns out, the 23.6% retrace from 734 and and the 23.6% retrace from 571 are the same ( within a few points.416/412). In this respect, one confirms the other, adding strength to the validity of the retracement. So what does that mean? Pass......save that if two different routes give the same answer, then it has merit by virtue of those routes.So is 416/412 going to be support? If so, then by the same routes, 321/316 will be the next support down.....
As it turns out, the 23.6% retrace from 734 and and the 23.6% retrace from 571 are the same ( within a few points.416/412). In this respect, one confirms the other, adding strength to the validity of the retracement. So what does that mean? Pass......save that if two different routes give the same answer, then it has merit by virtue of those routes.So is 416/412 going to be support? If so, then by the same routes, 321/316 will be the next support down.....
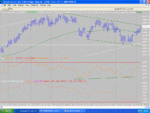
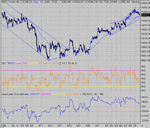
No drop and no consolidation. We did get a pullback to give breathing room, twice.... Difficult to get a clear idea of where the channels might be.... Interesting that those two RS lines meet at 320 ish- see above post re fibs. At least the smallest channel has a width of only 50 points, so a direction change will be quickly seen .The CCI triangle will also prove useful , if and when it breaks... Seems to me that there is little headroom, but then again, I got it wrong yesterday too....
Attachments
I don't mind being wrong.. in fact ,you learn more by being wrong than being right.....just so long as you go back and figure out where/why you got it wrong.
Easy day again, but another day of little in the way of targets. Did you take the first 64 break at 14:42? Always a risk going in early either way... Good plan, but not enough information, especially with the gap....
Another day of successive RS Switches that led the way... The final breakaway from 400 could be seen coming from the RSI strength in the prior up compared the the pullback to 401 before flying off. I got caught at the end, having closed and reversed off the top at 430, and doing the same at the 400 bounce gauging RSI to be O/S at 30.🙁 Still, I took a chance and added at 387 as RSI came off 20 and that came really good, right into the close. Why? because I got confirmation by way of divergence on ES RSI and a 2.5x vol peak.... 7 more points against and it would have been a substantial loss. You know what they say... Don't try this at home......
Attachments
tradesmart
Experienced member
- Messages
- 1,286
- Likes
- 22
CM – the fib grid I was referring to in the above post, shown on the right of the chart, runs from 9850 to 10750 ish giving 61.8% in the 10415 region – there is another fib grid on the left running 10750 – 9580 that I was using for another exercise……then to cap it all I made a reference to a fib retracement on today’s intraday move………
Fibs are definitely useful, but confusing if you have too many of ‘em on one chart/post….!!.... lesson learned.........😕
Quote of the day - Wall Street blue-chips experienced what some traders are calling “low-volume levitation”............. 😆
Fibonnaci, the great man himself, attached......
Fibs are definitely useful, but confusing if you have too many of ‘em on one chart/post….!!.... lesson learned.........😕
Quote of the day - Wall Street blue-chips experienced what some traders are calling “low-volume levitation”............. 😆
Fibonnaci, the great man himself, attached......
Attachments
Last edited:
Similar threads
- Replies
- 0
- Views
- 2K

