You are using an out of date browser. It may not display this or other websites correctly.
You should upgrade or use an alternative browser.
You should upgrade or use an alternative browser.
Soup de Jour...
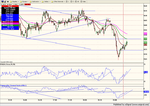
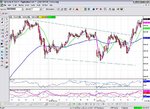
1: support found at 9564.
2: Note the slope change up wards before the triangle break...
3: The support test after it breaks.
4: Price goes straight through 9600- prior resistance.
5: Triangle target not quite met, followed by bull flag. RSI strength ratio is 1:1
6: Target for bull flag is 9635, not met.
7: 3 pk ND top resolved before T1 met.
8: The inverse"W" top ( ok, "M") has a target of 9644.
Something I need to investigate... Sometimes an ND top is followed by a continuation... Does the support line break of the ND top formation NORMALLY signal a short????
Here's what I see. IF an ND top is going to be a reversal,
a) it's immediate
b) it's strong
c) the break through support is convincing.
Otherwise, it takes a while to continue on up. Therefore I conclude that it would be safe to execute a reversal at an ND top, with the proviso that a losing trade will be small and controllable, against the reward of a rapid drop.
Attachments
china white
Established member
- Messages
- 979
- Likes
- 12
3rd knock at 1038
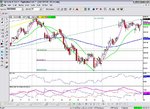
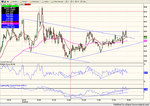
U may recall I talked about a C&H forming last week. IMO we have just completed forming a bigger C&H with all the hallmarks of a major B/O right round the corner (if u dont like C&H as a TA tool, u may just call it a developed bull flag :cheesy: ). If 1038 is taken out, I'd expect a "measured move" to 1068.
Of coz the alternative is a triple top at 1038. As u can c, RSI 60 min is forming a ND, however if u take a butcher's at the next post, u'll c why I reckon this alternative is much less likely.
Attachments
china white
Established member
- Messages
- 979
- Likes
- 12
bullish price action IMO
here is why I believe the bulls r favourites here. the pullback at 13;45 failed to touch the lower bound of the channel, delivered a R/S switch on RSI 5 min, which was fully confirmed by ADX cross 20 min later. Perhaps safest point to go long. Quite expectedly, a B/O of the channel later, due re-test of the upper bound (nice point to double your longs) and a pop to "magic" 1038 😀
However, this is earnings season, and as u perhaps understand, thell b loads of good news and just as many misses... We'll c what spin the Street will put on it. Either way, I expect a 30-point move within days.
Attachments
china white
Established member
- Messages
- 979
- Likes
- 12
btw, chose 60% on my QCharts images, but they seem 2 b just as big when pasted..... 🙁 my apologies. Any idea where I am cocking them up? 🙂
I concur , China. A Cup and Handle, with a recent bul flag breakout on the 10 min chart, confirmed by the last low failing to make support.Target? Let's say around 9900. Early next week timescale. That's presuming it delivers, of course. Could just as easily be a Trippe top with that sniff of ND creeping in on RSI.
Attachments
Not a lot to show for today.Open support at magic 32, a failed Bear flag and two ND tops. The first went into instant drop, as discussed last night. The second is clearly going to continue... having closed at HOD ( Famous last words). But then again, from time to time, I get excited and stick my neck on the block. Not that I take any notice of my own ramblings. Of more interest to me is that someone else ( China) sees what I see, even if it is on ES. He says 30 point move soon, which = a DOW move of 270 ish. I differ in that I read it as a tad less at 245 points . Either way , that's some nice up move on the cards. I just hope it doesn't happen on Friday.... We have seen some big moves in the past on the last day of the week. And that will scotch my DOW comp. entry. :cheesy:
Attachments
china white
Established member
- Messages
- 979
- Likes
- 12
CM - just crossed my mind - 1068 is not a special number at all (apart from William the Conqueror's battle of 1066 🙂 ), however, Dow @ 9900 will trigger testing 10K imo.... a really interesting point here! 🙂
Pete Hannan
Junior member
- Messages
- 25
- Likes
- 0
Chartman,
I've started following your analysis just recently, and I've downloaded your trading system.
Last night I watched the price rise above the 100 EMA at 18:34, pull back to test the line and then move up again. I entered a long at 18:40 which proved disastrous. Did I overestimate the significance of the breakout - well obviously I did - I was just wondering if you had a rule of thumb for the number of points that constitute a breakout before the pullback (12 maybe?).
Also, like fazalv, I spotted the ND late in the session and executed a half-stake short (I cut it before the close). Where would you recommend I best place a stop loss before entering such a position?
Comments are welcome from everyone, and please keep up the excellent posts.
Pete Hannan
Junior member
- Messages
- 25
- Likes
- 0
Thanks mombasa,
and is there then a points criteria for what constitutes a verified move away from the 100EMA after testing it following the break through?
and is there then a points criteria for what constitutes a verified move away from the 100EMA after testing it following the break through?
No, at that point u have to make a decision using RSI strength of move etc for judgement.
It's not easy - what I've found is that I can more or less figure out why the dow has done what it's done by analysing the TA after close, but realtime is another matter entirely - that takes a lot of confidence and patience.
Keep on studying CM & NB's articles - it takes time for it all to sink in - and lots of practice applying that TA.
Newtron Bomb
Guest Author
- Messages
- 1,602
- Likes
- 87
Handy hint to help with the learning curve :cheesy:
1 - Start copying the analysis onto your own charts so that you can see where and how trends and pattens are formed from the analysts perspective
2 - when you are confident you can do a little analysis of your own and start putting this on the charts and compare this to the analysis you are looking at to see how close you are
3 - Start paper trading with your analysis in real time and compare with the analysis done at the end of the day
If real time is not a possibility atm then look to scroll through bar by bar to see how you would have faired doing the above and then compare with the eod analysis
HTH
I can sympathise with Mombasa and Pete Hannan. In hindsight, I can now (after study of Newtron's/ Chartman's note) the patterns with entry and exit. Real-time during the trading day is a different matter.
Take the present patterns. we have been hugging the 100ema. Feels like we are going to go up but i can't get enough evidence to put on a trade. Let alone recognise a clear "Chartman" buy signal.
I am keen to hear your views/insight.
Take the present patterns. we have been hugging the 100ema. Feels like we are going to go up but i can't get enough evidence to put on a trade. Let alone recognise a clear "Chartman" buy signal.
I am keen to hear your views/insight.
Attachments
Well, I guess you "regret" posting the chart. It's very difficult. After my post I dipped in and ad sold on test of 100ema at 18:20 at 9605. It felt good for about 10min and after 30min serious doubts crept in. I read CM's notes again and put a stop in at 20pts above 100ema (was 9622). Then got distracted by collapse of UNTD, a recent short favourites (see my posts in US stocks) and to my surprise saw DOW down and RSI making new lows.
Like you I am keen to hear CM's analysis.
Like you I am keen to hear CM's analysis.