Dow Intraday Charts 05 Jul - 09 Jul

hi hammer,
have you looked at risk management and targets and stops and the like?
there's loads of pointers around t2w

if you can identify strong patterns in the price action and apply risk management then you're
well on your way. easier said than done :))

until CM comes back, you could dig back through his daily dow posts also some of Skim's earlier stuff in "no indicators revisited"

all the best,
neil
 
Hi all

Looks like the Dow may hit long term support at 10065 ish and make that reverse H.S
 
Hammer- staying out of a trade is a good move- even more so if you're not confident.... I said earlier, you don't have to nail the tops and bottoms ( that's really hard anyway, but easy in hindsight )- get in where you feel comfortable, and then manage the trade from there. The three main thing to concentrate on are- 3 pk ND, 3 pk PD and the 100MA rules. These will always mostly keep you safe and profitable. Reduce your bet size , maybe, and be a little bolder until you crack it....
 
Hi CM
Think there was a P/D from 2.30 to 3.05 followed by a triangle ended at 3.24. target 10238. Gave me confidence to hold on. Closed bet on short N/D from 4.04 to 4.12. Not the best exit but still profitable
 
Just 10 points of the top, so excellent. The best exit is the one that gives you a good profit and that you are happy with at the time. NOT the ones that anyone can pick out with hindsight!!! :cheesy:
 
Cheers CM. The only thing i find when using ND and PD is it is hard to define an objective for the price movement. I usually just watch the momentum and get out when it starts to diverge. Not usually at the most profitable points but at least its not at a loss!

Thanks
hammer :cheesy:
 
Hi All
Anyone else think we may get the big M target 10170?
 
Last edited:
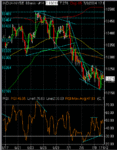
Looks like we may be forming a short term base at around the 50% fib mark of the 9910 – 10490 upmove.

A bull flag and PD on RSI implying support; the target of 10300 ish could be possible (but not today imho)

Those with Dow Comp entries at 10210 ish could be in with a chance……..(maybe……… ;) )

edit:- Mel - it might want to test 10170 again before any decent rise and the Nasdaq is still filling today's gap up......(always worth watching for....)
 

Attachments

  • 09-07-04.gif
    09-07-04.gif
    18.4 KB · Views: 240
Last edited:
Those with Dow Comp entries at 10210 ish could be in with a chance……..

Regards, Mystic Meg

(more from the 'Farside' than the 'Darkside'............)

ps - This Week's Average Prediction: 13475 (optimism reigns supreme LOL....!...... :cheesy: )
 
Great guess TS, but if you look at my entry, I left a digit out.... It shows as 10232, whereas I meant to put 10,213.2 :cheesy:
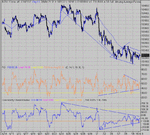
I'm gald you can make sense of this 'cos I can't. Bottoming out at 200? Narrowing on RSI/CCI could lead to a nice move.Still divergent over six days.
 

Attachments

  • dow 09-07-04 10.gif
    dow 09-07-04 10.gif
    40.5 KB · Views: 216
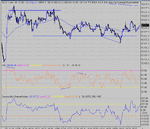
Aweful day, with barely 30 points range. Best you pay attention to the 100MA rules to stop yo a** getting whipped multiple times. :cheesy:
Plenty of chances to get out with minimum losses, or even a tiny profit, so long as you were patient. On day's like these, it's easy peasy to call it wrong and watch it all go pear shaped. The most important thing is to recognise the impending narrow ranges, don't panic, don't "reverse", get out at minimum loss, and stay out.
 

Attachments

  • dow 09-07-04 1.gif
    dow 09-07-04 1.gif
    28.8 KB · Views: 210
Hi C.M. I really like this thread, Its a lot better than trawling through dozens of stocks, and one can become familiar with s/r, patterns and to top it all we have a knowledgible guy trying to guide us in the right direction.One thing I would ask however is can you run over the 100 ma rules,
Thanks
 
I said 10240 and 10207 to finish guess I was wrong too :LOL:

Bottom at 10200 ? Nah! ;)
 
eddyjo said:
Hi C.M. I really like this thread, Its a lot better than trawling through dozens of stocks, and one can become familiar with s/r, patterns and to top it all we have a knowledgible guy trying to guide us in the right direction.One thing I would ask however is can you run over the 100 ma rules,
Thanks
Hi eddyjo,
best get confirmation from CM but here's an extract from a doc which outlines the system:
Day Trading the Dow Jones, DJI

Enter a trade on a confirmation of a break of the 100EMA, which is when the price pulls back towards the 100MA and then continues in the direction of the breakout.

Stay in the trade all the time that the price is "beyond" the 100MA.

Exit the trade on confirmation of a TOP or a BOTTOM. OR...

Exit the trade when the price has broken the 100MA in the opposite direction PLUS 20 points
IF you are in a trade AND the price is within + or - 20 points of the 100MA, DO NOT EXIT a trade. Remember, all the time the price is outside the 100MA (+/- 20) we DO NOT panic an EXIT.


DO NOT ENTER a Trade a trade if CCI <-200, >200 or RSI <20, >80
The reason is this, at these points we can experience major volatility. Look at figure 1 when the price pulled back at 8220 and CCI was at –200. You may be tempted to go long here. Bad move. A clear bounce off RSI 22 as well…. The open saw RSI drop to 18 or so and that fixes the low of the day so you have to be prepared for a drop back to that level. At these extremes, you need to wait for price confirmation, i.e. a higher high AND a higher low before going long at extremes of RSI and CCI. Remember this strategy is about safe trading, not suicidal gambles. Consistent small wins are the road to riches….

I'll try and find a link to the full doc for you.

Cheers,
Neil
 
Hi Chartman,
I'd just like to echo how valuable your threads are. I think us 'rookies' are able to get a perspective on the day from the posts on this thread and relate the views to our own trading.

Like today,there were opportunities but they didnt really go anywhere just like the Dow. Its very useful to get that feedback and we can compare our on views/results in relation to somebody who has your experience in trading on a regular basis over a long time.


Thanks C.M.

Triplepack
 
Bansir has quoted the 100Ma rules correctly out of "the manual".

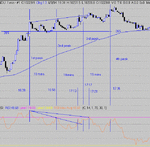
OK lets look at the perfect ND top, what it's attributes are and how to get there.....
Look at the chart. from 3rd June. For the perfect setup, we are looking for equal time spans between the 3 peaks.There is a MINIMUM of 12-13 mins ( 25 mins total) . Any less than this, then it's probably not an ND top, just a small reversal. In our case, we have a time span on 19 minutes between the first two peaks. Note that the slope across the first two peaks on RSI can be above or below the slope across the first and last peak on RSI. IF the second peak results in a slope above the final slope, ( either in RSI OR the price) then it's called a "bump top" as there is a bump in the middle.....
So, you have now identified a possible setup. we have a higher high in the price and a lower low on the RSI peak, AND our time scale is > 13 minutes.
Now what? Look for failure.... We don't expect the price to drop below the last low, in this case 263. The low just touches on 266.. So now we concentrate on two things. Primarily, we want to know where to expect the third peak. simply add the time "gap" to the time of the second peak. These are the vertical lines. In this case the gap time is 19 minutes, the second peak time is 16:58 so we get 17:17 as the "expected" time for the third peak. In this case there were two choices- either 17:14 or 17:21. Don't worry about this small discrepancy- it is quite common. Taking your exit on EITHER peak is perfectly valid. Note at this time, the third RSI peak ( at either of these two times, is higher than the slope line drawn from the first to the second peak in RSI.
There you have it. Forget that there was a fourth peak- you will only see this occasionally. Forget going short here, on the third peak, unless you are a gambler. Quite often on a good strong run, the price will dither or drift down slowly and maybe wait until the 100MA catches up and touches.... and then off it flies again!!!
The same is true for a PD bottom, but take real care if it occurs startin from the open..... They can drag on for ages, giving multiple peaks and continued divergence. Just like on today's 10 min chart. PD has now set in for 6 days, with 3 days being the norm before the price goes north.
Nothing is certain in this game, but knowing the rules and how to apply them will help you win more than you lose and win bigger.
 

Attachments

  • perfect ND.gif
    perfect ND.gif
    13.1 KB · Views: 228
Eddyjo
I think the complete set of rules you are looking for is in the thread called Trading the Dow Summary started by Newtron Bomb. The link is on post number 44. You can download the complete strategy.

Very useful it is too

I would have copied the link but I'm too thick.
 
Thanks to all who have contributed, I have just got back to the thread been tied up these last few days driving around visitors from Spain. What I need to do now is assimilate everything each of you have posted.

Thanks eddy.
 
Top