Dow Intraday charts 01/12 05/12

AnMolway
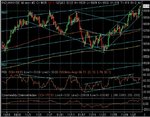
yes, use the ES SR lines to bolster a decision on the dow. You will find that the ES finds support/res at a particular number, but the corresponding dow value may be 5 dow points away( 0.5 on ES). It's often worth letting the dow run the extra 5 points...
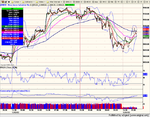
Checking the 1 min vol on ES is always very useful as confirmation of TA!
I used to have NQ up as well, but gave it a miss on the grounds of KISS. Far to busy for my old brain. :( I find ES vol the most useful as I can ( mostly ) hit the bottoms spot on. No pun intended.
 
Congratulations CM!!!

Insider knowledge?? :cheesy:


Bust out of the triangle on the INDU.
 
Well, 4th time lucky to break thro' 9900 (and I thought it liked doing things in 'threes'!!!!!! ;) )

Quite happy with the situation (nothing to do with my Dow Comp entry this week of course! :cheesy:)

but it's not over 'till it's over...........

that weak dollar could throw a spanner in the works yet.... :(
 

Attachments

  • dow 03-12-03.jpg
    dow 03-12-03.jpg
    119 KB · Views: 387
Thx Lockstoc.... not wishing to put my neck on the block twice in one week, I thought it more prudent not to put a target on the price to the upside, which was clearly 9938, + 60 from the breakpoint.( or - 60 from the base line which I did put a value on.)
TradeSmart , we did go in 3's... Ignore the "wrong guess" trendline, the next one down touched for the third time, and the triangle broke on the 3rd. attempt at resistance .
So now we're sitting mid channel and there looks to be plenty of room for a push up. ES vol on 1 min chart looks like the sellers got all dried up by 20:30 . If I call 10k by Friday's close, will it be the kiss of death or a perfect call?
 

Attachments

  • dow 03-12-03 10.gif
    dow 03-12-03 10.gif
    29.3 KB · Views: 397
Long off mid channel support and es vol divergence- same call as yesterday.....Then a dither at 9900 and a close watch on ES volume saw it diminish to almost nothing- a sure sign of a big move... The opening D/top trend line had provided a support line so staying long was a reasonable choice, with a clear exit on 9900 failure. If you took that loosely as a triangle, it had a target of 9950- which never made it, evidenced by the 3 pk out at 9840 ish. Where to take a short though?... Tough call, but in hindsight , anywhere would have paid off.... If it was going to carry on up, then 9940 would have to go. The first move came nowhere near it...the final move failing on 9940 and along with a D top was the place to go short. RSI ratio had also fallen from 1:1 to 0.5 in the up move. NAsty pullback, but again a quick check on RSI ratio gave 0.5 and the price touched the 100MA and obligingly dropped again, to cover near the close on PD. Quite an easy 100 points ish, but took some thought and care.( plus a bit of luck)
 

Attachments

  • dow 03-12-03 1.gif
    dow 03-12-03 1.gif
    24.4 KB · Views: 377
CM, Many congratulations with winning the MOTM award. Very well deserved; an acknowledgement for the great contribution you are making in helping many T2W members improving their analysis and trading skills. For one, your daily comments have helped me turn an erratic day trading style with highly volatile returns into a steady positive flow with much reduced risk.
Many thanks. I hope you will be at the Xmas dinner so we can toast on your winning of the 1st T2W MOTM award.
 
Are volumes down (or is something wrong with my datafeed?)

Do other members see similar signs of significant lower stock turnovers (see volume on chart). Futures volumes also seem to be a little lower?

Otherwise, rally from lows just above magic 64 at open seems to be peetering out but not yet over. Better Dow/RSI points ratio up than down! It would n't surprise me if next trade set-up will be a short (that is having missed going long at 14:45.
 

Attachments

  • dow.png
    dow.png
    174.9 KB · Views: 305
bgold

Got the same problem here.

Also running e signal, surely this must be a data problem. :(

Anyone out there who can shed more light ?
 
Bgold And other- I did mention yesterday that the close was at mid channel..... a clearly defined point from which to go long or short.... Right this minute, we're long, with ES vol just supporting a break at 9900/1067.Today so far, we are sitting in a new mid channel intraday with an RS sawitch ( potentially) on RSI.
 
CM

Our problem is more to do with no price bars printing on e signal and volume being down c 75%, cant believe the stats being reported to us via e signal are correct.

Can anyone post a chart of 1 min bars from the open to help clarify?
 
ES is currently sowing > average volume- 4k per 1 min tick
What do you want a chart of? ES or DOW 1 min or 5 min?
 
cm what do you think of the bull flad break out, it seems weak to me considering the es vol. but then again i haven't much experience of es vol
 
sorry and thanks for pointing it out. i think it's a pennant, now providing support to the falling price - or have i got it wrong again
 
anybody see a ascending tri forming ?

am still long - despite the ND - stop in place tho.
 
Top