Dow Intraday charts 01/12 05/12

74 target met, but no follow through... poss H&S ... support at 65 on up trend support line from yesterday. looking done to me..
H&S+ RS Switch. Can't tell which way this will go. Inv H&S on 5 min ES with support at 1067.5, which is about 9864 ish on the dow...
 
channel resistance just breaking out... 74 T2 gone , now looking at horozontal res at 9880 and a higher high off 9877
 
Struggling at 9874... but RSI ratios are at 0.5 ish so no panic ...yet...
ES breaking on vol :cheesy:
 
nice one CM - following avidly - i'm too burnt out from yesterday 2 take part, plus I've got a cold on the way :(
 
ES Vol divergence again... is this too good to be true? Dow on hor. res/support at 9880 . Stop has to be 80 ish now really...
RSI ratio is weak, RSI sitting un uptrend. dilemma. :(
I think I'll chance price uptrend channel support at 75....
ES supporting at 1069...
 
Evening all,


Just got in, scalped a few points on the Dax earlier- see the S&P is back up at new high-ish.


Anyone looking for a short??
 
CM,

yup - that's the dilema I had yesterday too :)

However, price has crossed the 10 & 30 ema down and the 10 is kissing the 30.

But, the rsi ratio is incredibly weak and no ND.

Sorry, not wishing to teach the master - just keeping in touch :)
 
yes, ratio is weak...
No short here....yet
Plenty of room now for a push up, BUT it is USA lunch time and vol is real thin...
Still in.
Stop at 75 now.( 1069 ES)
ES trying for HOD at 1070
 
ES vol coming back in and pushing hod 1070. Looking sweet. And there I must leave it till later..... you know where the stop is.....
 
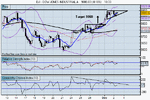
Had a better look at all the charts- is that another triangle forming on the Daily INDU? With a target of 9950


Also on the 5 min D4F looks like an INV. H& S- could be too small a time frame to mean anything.
 

Attachments

  • dow jones industrial a.gif
    dow jones industrial a.gif
    20.4 KB · Views: 535
thats one weird pattern on the 5 minute dow at this time, i'll have to call it inverted starship.....
 
hi everyone, does anybody apply s/r lines to the s&p just to give an indication to confirm the s/r lines on the dow, i mean to say when we have two indices that tend to go more or less in line together and each one displays similar s/r lines then the breakage of these lines will be more meaningful

hope that makes sense.

ps ive also found that the pivot points are also of use on the futures as well as the indices
 
Anmolway

I trade the YM based on what the ES and NQ are telling me. Several people have sai if you chart the ES and NQ why not trade them, but I like it the way it is and find I get a very good feel for what`s happening.

Steve
 
Today is a good case in point, todays sell off can be seen clearly on the ES and NQ as a failed breach of yesterdays high, but the DOW/YM gave no clue that this was the case :D
 
thanks steven, i know exactly what you mean, when the s&p started to fall from 1071 down to 1065 it was clearly seen on the e-mini that the pivot provided support.
shame i didn't trade it though
 
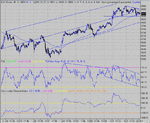
Watch this triangle that is developing..... 60 points on the mouth = 9900++ or 9780.
 

Attachments

  • dow 02-12-03 10.gif
    dow 02-12-03 10.gif
    30.8 KB · Views: 479
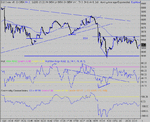
Following on from the real time commentary, out on the nd top at 9888( and a quick check on ES shows vol divergence) and short at 9885 on tl break and middle peak on the ND top. One more uptick on that first bottom would have been an out, signalling a news spike "V" bottom, and back to par, but it didn't happen( luckily), instead bouncing on 38% to carry on down. Into the bottom at 9840 ( hor support?) and a quick check on ES vol again, which shoed divergence.Out at 9845. Long at 9852, looking to break back up, which never happened, closed at 58..... eventually.What a time waster....
 

Attachments

  • dow 02-12-03 1.gif
    dow 02-12-03 1.gif
    25.7 KB · Views: 451
Top