Dow 2007

Rollover Dow position

Can anyone help pse? I rolled over my short position tonight only to find I had been charged the usual 1 pip plus an extra 3.7 pips. Apparently, this is due to the "Dow dividend payments reflected in the price every Tuesday".:confused:

Is this correct and if so can someone please explain to me how this is the case? It also transpires that long or short, an extra charge would be made tonight.

Thank you very much

Hi. Are you trading a "cash" index in a bucket shop? If you trade in a bucket shop, it is best to trade the futures contract. Most SB firms have a "daily future" with the same spread as the daily cash. Most don't automatically roll over, but you can call the desk and ask them to roll it for you.

As far as I know, the futures price has the dividends incorporated along with the financing cost. SB firms try to generate an accurate cash price by adjusting for dividends and financing. The FV changes at intervals, but it is mostly the discretion of the SB company. They won't let the price get too incorrect, but sometimes they choose one day to price in dividends, or they forget to update the FV in the morning and adjust the contract during trading, etc. Could you give us some more information?

Ideally, it is best to trade a SB index which has an actual traded underlying -that way it is easier to verify "fair play". Hope this helps.
 
Hi lurkerlurker,

The position is indeed with an SB company and they obviously choose Tuesdays to factor in the dividends. I read so much on this website about SB companies being crooked that I thought I had better check. Many thanks for your reply; it was most helpful.
 
Hi lurkerlurker,

The position is indeed with an SB company and they obviously choose Tuesdays to factor in the dividends. I read so much on this website about SB companies being crooked that I thought I had better check. Many thanks for your reply; it was most helpful.

Pleased to hear it. Does your SB firm have "daily future" contracts you could use instead? These will more closely mirror the underlying. I know CS, IG, and TradIndex have them - CMC don't unfortunately.
 
Yes it does. I shall investigate! Thanks again.

Hi guys,

My charts on the weekly and dailies for DAX looks bullish but the 4 hours looks pretty bad at it's resistance line.

Did somebody say the DOW follows DAX?

I can't help thinking tomorrow the DAX will fall and DOW will rally to prove me wrong. Or will the DAX fall and DOW follow it?

If the DAX goes above 8000 at least we'll have consistency and I may consider going long on the EURUSD.

Good trading everyone...
 
smoke and mirrors

the Dow is at record highs.....for who??

It may explain the Dow's resilience if overseas buyers view US stocks as cheap in local currency....still someway to go till all time highs based on these charts...food for thought perhaps

not in pounds,euros,Aussie $....amazingly in Canadian $ it's actually retracing whilst Dow goes up last few weeks.
The Japs are getting a decent run though....:rolleyes:
 

Attachments

  • dow £.jpg
    dow £.jpg
    12.2 KB · Views: 138
  • dow ayssie.jpg
    dow ayssie.jpg
    10.7 KB · Views: 157
  • dow cana.jpg
    dow cana.jpg
    11 KB · Views: 135
  • dow e.jpg
    dow e.jpg
    18.6 KB · Views: 152
  • dow yen.jpg
    dow yen.jpg
    11.4 KB · Views: 156
the Dow is at record highs.....for who??

It may explain the Dow's resilience if overseas buyers view US stocks as cheap in local currency....still someway to go till all time highs based on these charts...food for thought perhaps

not in pounds,euros,Aussie $....amazingly in Canadian $ it's actually retracing whilst Dow goes up last few weeks.
The Japs are getting a decent run though....:rolleyes:

interesting stuff .. wonder what it looks like in gold ..
on the one hand it reminds the bears that there is plenty room above, but on the other hand maybe an inflation adjusted dow looks like a bear market already:confused:
 
interesting stuff .. wonder what it looks like in gold ..
on the one hand it reminds the bears that there is plenty room above, but on the other hand maybe an inflation adjusted dow looks like a bear market already:confused:

ask and thou shalt receive....:LOL:
 

Attachments

  • dowgold.png
    dowgold.png
    42.3 KB · Views: 181
ask and thou shalt receive....:LOL:

Awesome charts Steve many thanks.

Scalping away at the DOW last couple of days trying to make up for my losses.

On Sunday the daily charts looked bearish. Forgot on Mondays markets normally rise and what a stormer it was...

However, checking my charts again - I hate to say it still looks bearish. Either it will bounce back up from 13950 or it will go down. I'm 51/49 bearish.

I heard Mondays rise was on very little volume. So it seems it is not very convincing rise and most people have doubts or are on the sidelines.

Good trading everyone. :)
 

Attachments

  • US30 Cash071003.png
    US30 Cash071003.png
    23.7 KB · Views: 172
Bank of England Maintains Bank Rate at 5.75%

The Bank of England’s Monetary Policy Committee today voted to maintain the official Bank Rate paid on commercial bank reserves at 5.75%.

The minutes of the meeting will be published at 9.30am on Wednesday 17 October.
 
ECB Holds Rates at 4.00%

ECB also holds rates steady.

This isn't good for the dollar. These are the first rate decisions since the last FOMC meeting (cut of 50bps). I'm expecting a cautious opening on Wall Street, but not too sure until we see the new claims number at 1:30.
 
Jobless Claims (New Claims) are up again, but the market is still shrugging it off.

I'm nowhere near as certain about tomorrows employment number as I was last month, and I am cautious about taking a position into the number. However, the headline nonfarm employment change is predicted at around +100K. This isn't quite as silly as the +118K estimated for the August figure reported the first week of September this year, but I'm still expecting a lower number.

For what it is worth, the Fed is perhaps less likely to cut rates now that the petrodollar states, the BoE, and the ECB have declined to follow suit. Any rate cut is already priced into the market - we're not going to get another cut of 50 basis. An employment number less than +90K tomorrow is going to bring the market to its knees.

The exception to this would be another negative number, which might provoke a stubborn bullish reaction as the Fed might need to cut rates further than first expected. My money is on a number between 40K and 70K.

Last month I predicted around 40K (not 118!) but was surprised with -4K. For what it is worth, I think the market is getting too optimistic pricing in such a large improvement in payrolls, especially given the weekly jobless claims are up again.

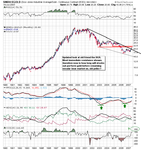
USD looks bearish in the longer term, however perhaps there will be some unwinding of short positions before the number. After, who knows? The US economy is in tatters, and this will continue to show in the employment situation. Higher unemployment will lead to greater credit defaults. They are not out of the woods yet.

It is nice to see other central banks reacting more sanely and not just recklessly cutting rates. As I type this, the Dow is looking to open higher despite new jobless claims being several thousand above consensus. This will be corrected into EOW after payrolls tomorrow.
 
questionable value :Conundrum

Market in great shape and this is so far just a counter trend pbk but........

I hear the floor traders sold stocks for three weeks running into the Fed decision when most people knew that a cut was likely ....... next week we find out if they made it 4 in a row or if they are back on the buy side....

(The data has a two week lag so latest figs is to Week ending 14 Sept)

Why would these smarties buy the lows in August and then be so quick to sell thereafter ? Are they really buying stox now so close to all time highs ?

Sorry for the verbal d :)lol: ) .........just a thought

Edit: I meant the market makers/specialists not the floor traders.
 
Last edited:
Awesome charts Steve many thanks.

Scalping away at the DOW last couple of days trying to make up for my losses.

On Sunday the daily charts looked bearish. Forgot on Mondays markets normally rise and what a stormer it was...

However, checking my charts again - I hate to say it still looks bearish. Either it will bounce back up from 13950 or it will go down. I'm 51/49 bearish.

I heard Mondays rise was on very little volume. So it seems it is not very convincing rise and most people have doubts or are on the sidelines.

Good trading everyone. :)

charts attached..weekly looks like one more push needed, daily neutral (maybe slightly bearish ie corrective), 1 hour looks like we are at key breakout level..break through 13940 could mean deeper correction, to 13850

FTSE strong holding above 6520.. DAX still meandering
GOLD - short term low @ 722 cash? break below there may see 690
 

Attachments

  • DOW JONES INDUSTRIAL60 mins A.png
    DOW JONES INDUSTRIAL60 mins A.png
    30.3 KB · Views: 131
  • DOW JONES INDUSTRIAL daily.png
    DOW JONES INDUSTRIAL daily.png
    29.9 KB · Views: 132
  • DOW JONES INDUSTRIAL weekly.png
    DOW JONES INDUSTRIAL weekly.png
    27.2 KB · Views: 129
charts attached..weekly looks like one more push needed, daily neutral (maybe slightly bearish ie corrective), 1 hour looks like we are at key breakout level..break through 13940 could mean deeper correction, to 13850

FTSE strong holding above 6520.. DAX still meandering
GOLD - short term low @ 722 cash? break below there may see 690


I concur with your views and charts Catracho, weekly looks bullish to me too.

I decided to take a quick scalp based on 15min charts and went long @ 13983. Currently down a little. SL @ 13950...
 
Yeah I went and got something to eat... came back and the graph shows a range bound boredom market! Anyone even bothering since 3pm?
 
Confusing.......

First off...
Dow not that far off the weeks lows and can be had fairly cheaply in case of a boom tomorrow...... European indices are not fussed about tomorrow .... :rolleyes: :LOL:

---------------------------------------------------------------------------------------------------
But in the last few days many markets have sniffed/hit multiyear highs....
Gold/Oil/Dow/Euro....HongKong :)lol: ) .....and the carry trade seems well and truly established...

A perfect world.... But what if....??

The long side is easy to play (dow30) so I'm preparing for a move in the other direction - just in case....

Edit: $/Y 116.48 seems as fearless as the european indices in the face of tomorrows uncertainty ...
not sure what to make of it.... :)

Dow 960 mid price
 
Last edited:
Top