mark twain uk
Established member
- Messages
- 618
- Likes
- 4
Hi folks,
Wishing everybody a Very Merry Christmas and a Happy and Prosperous New Year.
Wishing everybody a Very Merry Christmas and a Happy and Prosperous New Year.
dc2000 said:not as many points as anticipated from my trade still looking to close early doors around the 500 mark will do me then take some time off from trading
Silvertip said:I dont know.. when will these bears ever learn ! 😉
frugi said:Good Lord a textbook chart pattern actually worked. Don't mess with an Adam and Eve top 🙂 Especially if it comes after a double top at same resistance level.
Ok not as pronounced as this one, but the spirit of the pattern definitely in evidence.
http://www.trade2win.com/traderpedia/Adam_and_Eve
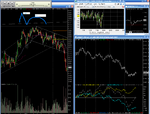
Also this morning contrarian delight of put/call ratio at 0.6 and a nasty looking size / minnow delta divergence developed till 16:30ish. Light blue line shows aggressive selling. Yellow line little bottom pickers (?) ... all unproven conjecture I know (the market will not be confined by mere ratios) but this sort of divergence often works & shows who is up to what in terms of size. Aboy 50% of the time LOL. 😱
Put/call heading up to 1.0 as I type and size seems to be easing their selling. 12474 LOD? Or another 40 points down ... heh heh. Double bottom on cash and good place for support on 240m for what it's worth.
frugifrugi said:Good Lord a textbook chart pattern actually worked. Don't mess with an Adam and Eve top 🙂 Especially if it comes after a double top at same resistance level.
Ok not as pronounced as this one, but the spirit of the pattern definitely in evidence.
http://www.trade2win.com/traderpedia/Adam_and_Eve
Also this morning contrarian delight of put/call ratio at 0.6 and a nasty looking size / minnow delta divergence developing till 17:00ish, a possible warning of what was in store. Light blue line shows aggressive selling while yellow line shows little bottom pickers (?) buying ... all unproven conjecture I know (the market will not be confined by mere ratios) but this sort of divergence often works & shows who is up to what in terms of size. About 50% of the time LOL. 😱
Put/call heading up to 1.0 as I type and size seems to be easing their selling. So, 12474 LOD? Or another 40 points down? ... heh heh. Double bottom on cash and good place for support on 240m at the mo, for what it's worth. Done trading for the day but would probably long 350 cash if she got there. Happy Xmas all.
a bit more down and then more up i want to see the 1455 cashSilvertip said:May I also wish the contributers of the thread the warmest of wishes for this festive period, may December 25th be the catalyst for the arrival of warmer days once again.
Todays Dow, I still dont see any reason to be shorting this market as it appears to me as though we are seeing the longs being shaken out of the next move forward. We have dipped a few times so far, but nothing more than that. I will remain bullish until such point I have obtained a signal to the contrary.
Atilla said:I think the DOW30 has taken a turn and whilst I wouldn't be too concerned at the moment if I was still long, I'd watch for a break of the 12350-30 regions, just in case. This point also coincides with the 20d MA. I'd put my stops there if I was long.
If it falls further and breaches 12300 the 40d MA then I think alarm bells should be ringing.
There's a divergence in the MACD & Price movement for the daily charts. I can't see a pickup with the holidays kicking in.
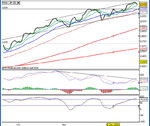
On the S&P500, if we don't brake out of 1422-5 (double top) I think the sell off for the S&P500 may end at 1406 regions tomorrow. Once again due to the holidays I'd guess.
The MACD for the weekly S&P500 charts are showing pretty over extended prices to me. What better time to take profits than over xmas holidays.
andycan said:thats the problem with indicators they can be overbought longer than most anticipate
this may well be the case AtillaAtilla said:Yes true, but the indicators are only backup to the actual price movement. The divergence has been there for about couple of weeks.
My guiding principal is the price and the MA20. From about 2pm onwards it headed down south. When the hourly MA 5 & 10 started crossing each other likewise, the combination of signals was too strong to ignore. Key ingredient I think was Patience.
I'm still cautious about a rebound but unless the MA20 is crossed on the hourly charts I'll consider the downtrend to continue.
Can anybody else see a double top reversal on the S&P500 hourly charts :?:
If confirmed - dare I say this is going to be a sure bet to 1405-10 regions.
nice when a plan comes together!!andycan said:a bit more down and then more up i want to see the 1455 cash
merry xmas to all
andycan said:nice when a plan comes together!!
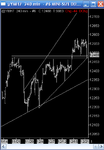
note this resembles the gartley pattern, i was not thinking of this at the time but the 1:1 is in this case the minimum requirement not always thoughi would have liked a little more down
AtillaAtilla said:Hi Andycan,
What is this TA with the triangles called? I've looked up triangles but my books only refer to ascending / descending and wedge type triangles?
Otherwise it's been another reasonable day for me. Wondering weather my 1406 target will be reached. I'm now considering wheather/when to close my position.
I can't help feeling though the market has held up well and do agree not much movement at the moment. Hence, I suspect a surge will follow after these falls as you suggest.
Also, noticed Microsoft MSFT looks like having produced a H&S formation. As the Nasdaq did not accompany the last DOW rise I've taken it as a signal to short it expecting the worst.
Microsoft also announced they will not be releasing another Operating System for sometime but choosing to carry out upgrades or patches. The IT industry can only bear so much. Other than fancy interface and some additional security (which people can buy for £20 anyway) there isn't much in Vista. Only benefit is it keeps people like me off the streets I suppose. 😛 Can't see where they are going next year. Fancy selling XBox at a loss with PS3 and Wii hitting the shops too. 😱