dbphoenix
Guest Author
- Messages
- 6,954
- Likes
- 1,266
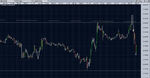
Db and Fugs, I see similarities in the zones that define trades in our charts.
If the focus is on where buyers step up to the plate and where they say f**k it, then the zones should be similar.
Db
Db and Fugs, I see similarities in the zones that define trades in our charts.
Take any indicator-based EA and optimize it for the past data for over 10 years to have a steady upward profit curve. Why will it inevitably fail soon after you start trading it live if TA as means of market prediction works?
You just set it up on your VPS and it runs from there. How would a computer program trade it?If you were to trade it as if you were a computer program, then it likely would not fail.
Hi dbp,As long as charts are being posted . . .
Take any indicator-based EA and optimize it for the past data for over 10 years to have a steady upward profit curve. Why will it inevitably fail soon after you start trading it live if TA as means of market prediction works?
You just set it up on your VPS and it runs from there. How would a computer program trade it?
It wouldn't hesitate.
It wouldn't have doubts.
It wouldn't chase.
It wouldn't revenge trade.
It wouldn't less losses run.
It wouldn't cut profits short.
It wouldn't be afraid.
It wouldn't be arrogant.
It wouldn't get tired.
It wouldn't get hungry or have to go the bathroom.
It wouldn't be distracted by trading forums.
Db
Hi dbp,
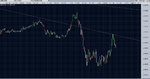
I thought I had my head around the SLA and, as such, I would have expected you to exit the short 3 bars earlier when price closed above the supply line. What am I missing / overlooking?
Tim.
Aha, gotcha, it's the 'fuzziness' that I wasn't factoring into the equation!. . .But this sort of fuzziness is exactly the sort of thing that the beginner and the struggling trader should avoid like the plague.
Aha, gotcha, it's the 'fuzziness' that I wasn't factoring into the equation!
😛
Jesse Livermore went through all this a hundred years ago.
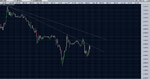
Technicality does not work? ... this down trend line shows you a trader could have money twice..
Jesse was a loser. In the end the bank took all he's got. His failure was his size. If he kept his size small, the bank would not have been able to take him to the cleaners.