I was asked the other day about "volatility" by a popular media outlet. The question was: "What should traders and investors do in a volatile market?" I didn't have to think about the answer, I had it before they were halfway done with the question. Simple, if you don't know how to time the market's turning points in advance, don't have money at risk in the market. If you do know how to time the market's turning points, you love market volatility. Recently, the markets have experienced a period of extreme market volatility. During these periods, those who know market timing typically see above average profits and those who don't experience above average losses. No matter what type of trading or investing you are doing, you can't get around market timing. Furthermore, turning to the world of conventional technical and fundamental analysis for market timing is NOT the answer because these two lagging schools of thought are high risk and low reward. If you don't believe me, go ahead and try it, but remember I warned you.
Let's take a look (below) at a recent and very important session from July 20th, five days before the major market collapse. We started by analyzing the weekly chart of the S&P Futures. We have been going over this chart for weeks because price reached our pre-determined supply level of 1345, the lower yellow shaded area on the left. This is a supply level because it meets our definition of a price level where supply greatly exceeds demand which is very different than the conventional definition of "resistance" that you read about in the trading books.
Let's take a look (below) at a recent and very important session from July 20th, five days before the major market collapse. We started by analyzing the weekly chart of the S&P Futures. We have been going over this chart for weeks because price reached our pre-determined supply level of 1345, the lower yellow shaded area on the left. This is a supply level because it meets our definition of a price level where supply greatly exceeds demand which is very different than the conventional definition of "resistance" that you read about in the trading books.
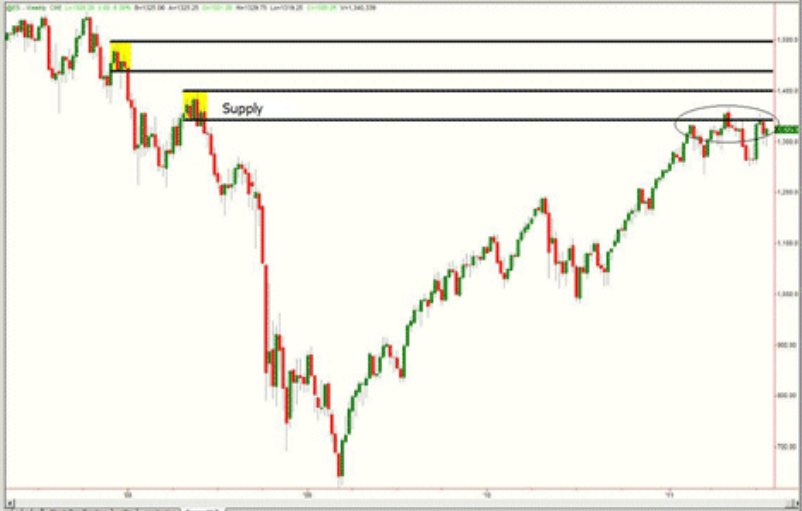
Figure 1
In this session based on the chart, there was plenty of supply in this level and that the risk to a market decline was very strong. The plan was to either exit long positions at the supply level and/or initiate low risk short positions at the supply level in the S&P (stock market).
Before figuring out where the profit target was below (demand), there is something else that is so important. Take a close look at the price action on the right side of the chart where price is reaching the supply level (circled area). That picture is the start of what conventional technical analysis calls a "Head and Shoulders" pattern. It's in almost every trading book ever written. Try and find a book that talks about technical analysis that doesn't cover and promote this trading pattern; it will be hard to do. While this pattern has been forming, I have been hearing that because this pattern is so popular, it must work and make everyone money right? Think again... I would argue that this conventional chart pattern is one of the most ridiculous things I have heard of in the world of trading and here is why. Think about the rules of the pattern which are the same in all the books. The pattern becomes official when you have the two shoulders, the head and then when price declines to the lows of the pivots in between the shoulders which is where you draw a line called a "neck line." Then, once price trades below that line, you are supposed to sell short. In other words, instead of selling where we were selling which is when price is high and into the supply zone, you're supposed to wait for a big price decline and then sell.
Does this make any sense to you??? This goofy pattern goes completely against how you make money buying and selling anything! As a trader, I love the pattern because I know that the masses who learn to trade reading the books will sell well after we do at lower prices which helps us who sold higher profit. As someone who cares deeply about people and their financial well-being, it's a dangerous way to speculate in markets that are high risk and very low reward. I can go on and on with how irresponsible it is to promote this conventional chart pattern, but I think you get the point. To sum this chart and analysis up, I simply used a simple rule-based market timing strategy that helps protect investment capital from a major downside move and also profit from it.
Next, it was time to figure out where the market was likely to fall; market timing works both ways. This means finding the nearest "fresh" demand level below our weekly supply level. For this, we went down to the daily chart. As you can see below, the demand started at 1230.
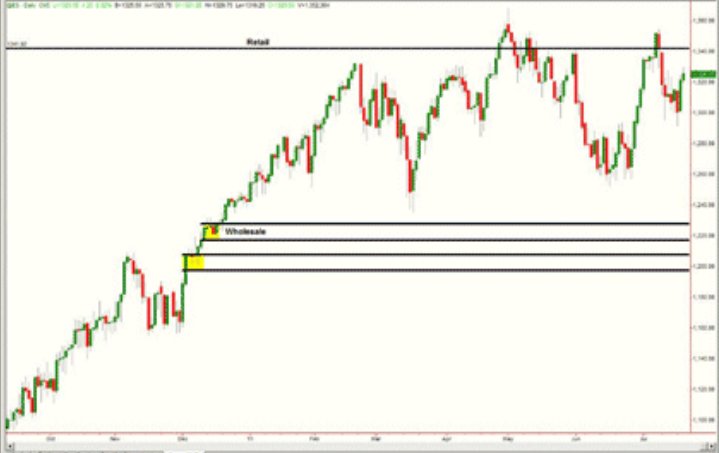
Figure 2
This meant that we were expecting a 115 point drop to the first demand zone which was very big. To many people, this would seem extreme, but that is where the rules said the nearest demand was. There was a big cluster of trading at 1260 before our 1230 demand, but to us, that is not demand at all, though conventional technical analysis would say it is. The level just below that was started at 1206 and went all the way down to 1195. Needless to say, there was plenty of room for price to fall.
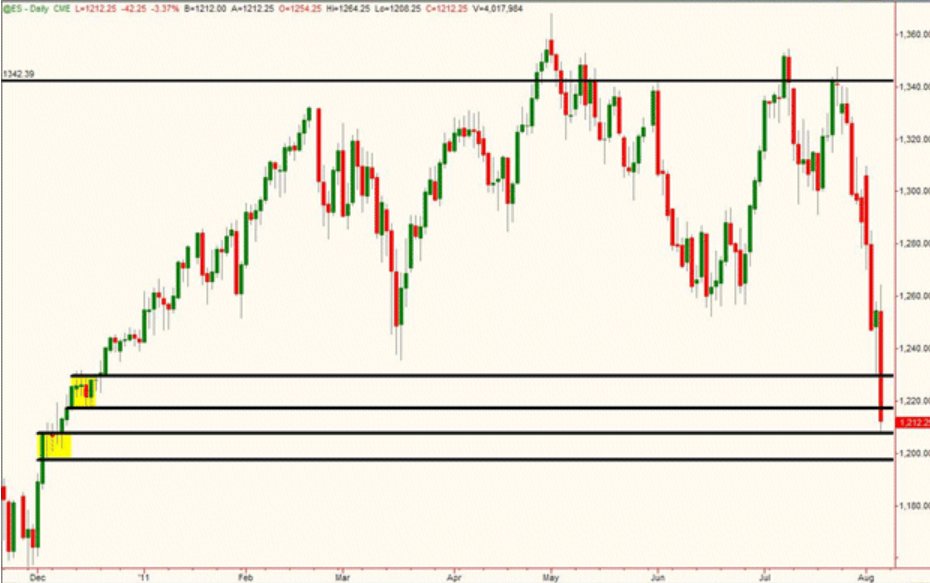
Figure 3
Within two weeks, price collapsed into the anticipated areas of demand. When price hit the first demand level, the S&P had a 30 point bounce as expected. After reaching some intra-day supply, price then proceeded down to the lower demand level. The rule-based analysis had paid off.
During this ten day decline in price which was the sharpest decline in a very long time and put the major indexes in negative territory for the year, billions of dollars in market cap was erased, the average investor lost over 10%, and fear gripped the world. What the average person/investor doesn't realize is that the losses could all have been avoided and they actually could have profited from this downside move. The average person is told by Wall Street that "market timing" is something you can't do and that is simply wrong. Have you ever taken a moment to think about why Wall Street would say this over and over? If the average person starts buying low and selling high, Wall Street will have no one to buy from and sell to. This is why Wall Street makes so much money and the average investor never comes close to achieving their financial goals.
If this article comes across as a little harsh, please understand that I travel the world talking to so many new traders and investors, honest, good, hard-working people that are simply misled by completely wrong information and that really bothers me. What bothers me most is that they don't know they are being misled because they are new (novice); they don't know what they don't know. The action we have taken in the markets over the past couple of weeks is not meant to impress you. It is meant to impress upon you that you can have a very good idea where market prices will turn and where they will go by following some simple rules based on the core supply and demand strategy. If you are feeling pain from the markets' decline or volatility, find comfort in the fact that there is an answer, a solution that will help you feel like you are more in control and will help you achieve your financial goals.