Does technical analysis work or not?

Does technical analysis work in your opinion?


  • Total voters
    65
Ah, I havent as yet traded this particular indicator as its for gold only. However,,, im very tempted.
Trading live by this (or any other) indicator would be the ultimate and only truly meaningful proof of technical analysis (not) working on a consistent basis.

If you genuinely believe in something, why not actually start enriching yourself immensely with it wasting no time on talk (which, as we know, is pretty cheap)?
 
Db, would you be so kind as to apply your SLA analysis to his chart and post it?

Like to compare his entries against yours.

TIA

No need to post anything. Just short the lower high on the 17th.

Db

Edit: Just saw DT's post. His entry may or may not have been coincidental. I don't know the reasoning behind it.
 
No need to post anything. Just short the lower high on the 17th.

Db

Edit: Just saw DT's post. His entry may or may not have been coincidental. I don't know the reasoning behind it.

Thanks. That's only trade on that chart you'd have taken?
 
Thanks. That's only trade on that chart you'd have taken?

Depends on how much you want to get into it. Most of what I might say wouldn't make much sense if one hadn't read the pdf on this. For one thing, I suspect that most experienced traders wouldn't hang around after that parabolic rise, knowing full well that that sort of thing not only can't last but fails rapidly. Therefore, someone who'd worked with this for awhile would switch to the hourly and exit once the spike failed, that is the afternoon of the 11th. If for some reason he didn't, he'd exit on the lower high the following day. He might even short at that point then go long again on the 18th. And so on.

But all this assumes that the trader knows gold, has studied it, knows how it moves. That will tell him, for example, how successful breakouts in that instrument are and whether or not waiting for retracements is smart (waiting for retracements is definitely the way to go with the NQ). The SLA applies to all freely-traded instruments but some are easier and simpler than others. Some trend well and some spend a lot of time in chop. The SLA will keep the trader from doing anything stupid, but it is of course more profitable when applied to instruments that trend well.

I should also point out that this is what technical analysis is all about, and has been since the beginning, judging the balance between buying pressure and selling pressure, demand and supply. But not everyone cares about making those judgements for themselves, so they use indicators or patterns.

Which brings us back to the subject of the thread.

Db
 
I guess it works if you use momentum and important levels for your trades. However that's not enough to trade profitably - I think Tim already posted about it (trade management etc.)

About patterns - I don't know. I've never managed to trade them profitably. Somehow they tend to fizzle out. Divergences - maybe not if markets are rigged (like forex)
 
I still trade old school patterns but very rarely. Last one I took was a shs on eurgbp about a week ago. I just use levels and trend lines. I don't enter a trade on any pattern in general;when it aligns with levels then I will.

I'll post something up to show what I look at
 
Last edited:
BTW I've tried all sorts of TA approaches, even point and figure, but never Ichimoku.

I've just read an article here on T2W. I'm interested if anybody uses it to trade profitably? Also if it can be used for intraday trading?
 
TA works but is not science, is an art form.

There are numerous technical approaches, the more we use the less chances we have, simplicity is best in my view, drawing the proper trendlines can help as the previous daily highs/lows for intraday, here a tiny reaction is required but not always. One has to find "his way".

Best is to enter at extremes were seems no possible a turn, if you enter in the middle of the chart you will be chopped out, patience is a must, wait for prices to get to you if they react take a chance.

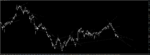
today bought GU @ 4054 where every body was selling and covered @ 4119.

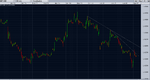
Smaller time frame like 5m will help you enter at better price but they are more difficult to master, 15 t0 60 minutes give more reliable set ups, still patience is a must, you do not have to trade every day...

Here you have it a complete system......
 
Last edited:
This is about as technical as I get.
 

Attachments

  • EURJPYM30.png
    EURJPYM30.png
    118.3 KB · Views: 198
As long as charts are being posted . . .
 

Attachments

  • Image14.gif
    Image14.gif
    36.2 KB · Views: 184
Thank for sharing Fork....


and this is mine, during london session prices made a BOPB at the previous day low, the signal bar was a bear inside bar.......then prices turned at the low of 16 March as a FBO, the signal bar was the reversal bar...

Zoom in on your chart to see what I am talking about...
 

Attachments

  • gu.png
    gu.png
    45.2 KB · Views: 166
Each chart has shown a unique perspective on TA. I don't look at bar patterns and as you can seen I have it zoomed out and all white. The way I see it price bar analysis has never worked for me. Instead I scope the ranges and trade the best R/R I see both ways.
 
Db and Fugs, I see similarities in the zones that define trades in our charts.
 
Each chart has shown a unique perspective on TA. I don't look at bar patterns and as you can seen I have it zoomed out and all white. The way I see it price bar analysis has never worked for me. Instead I scope the ranges and trade the best R/R I see both ways.

I see what you mean... we need to trade what make sense to ourself....

Personality I need to see a reaction because in my own perception a technicality is only technical in my mind until I am proven right..

If I am very strong about a technicality I will scale down to a smaller TF but still I need to see a reaction and I will reduce my stake.....

Interesting chat...but I need to go...I have a busy day....ciao.
 
Top