You are using an out of date browser. It may not display this or other websites correctly.
You should upgrade or use an alternative browser.
You should upgrade or use an alternative browser.
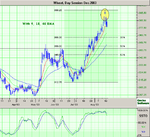
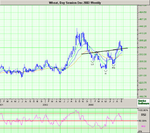
On the weekly chart...
We see a completed reverse H&S pattern. A retracement on the daily to the 50% level, would correspond to a retracement to the neck line on the weekly. This is not uncommon of course. But it has to stop there in order for the pattern to be valid and the next leg up. Just my 2 cents.
Good trades to you all !
Andreas
Attachments
Andreas,
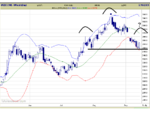
Thank you for posting the chart. The textbook Evening Star formation had caught my eye but I was too busy/lazy to post it up!
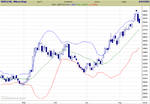
One more factor supporting a retracement from here is that the long white candle that opened the Evening Star pushed outside the top Bollinger Band (2 std devs) and the candle that closed the pattern dropped back into the band.
The conventional wisdom initial target for this BB set up is the centre of the band i.e. the 20ema, currently at about 370.
I have taken a wee short position with some trepidation as this sort of countertrend play is not my normal territory. It is often described as 'stepping in front of a freight train' which is not a particularly elegant expression. 'Catching a falling knife' is much more evocative but I can't think of how to turn the expression upside down! 'Trying to catch a space shuttle'? 'Riding a rocket'?
Hhhmmm. I'll keep trying.
Thank you for posting the chart. The textbook Evening Star formation had caught my eye but I was too busy/lazy to post it up!
One more factor supporting a retracement from here is that the long white candle that opened the Evening Star pushed outside the top Bollinger Band (2 std devs) and the candle that closed the pattern dropped back into the band.
The conventional wisdom initial target for this BB set up is the centre of the band i.e. the 20ema, currently at about 370.
I have taken a wee short position with some trepidation as this sort of countertrend play is not my normal territory. It is often described as 'stepping in front of a freight train' which is not a particularly elegant expression. 'Catching a falling knife' is much more evocative but I can't think of how to turn the expression upside down! 'Trying to catch a space shuttle'? 'Riding a rocket'?
Hhhmmm. I'll keep trying.
Attachments
ianshep,
Nice chart ! I use Bollinger Bands standard with my spread trading, because specially there they are very reliable. Only I use them with the 20 SMA in stead of the EMA. If the retracement goes back to the 20 SMA initially, this corresponds with the 38% retracement. I agree with you about the 'freigt train' 😀
Good trades to you !
Regards,
Andreas
Wheat bounced off support at the 38% retracement. Looks like it is ready to continue up. Fridays move upward however was in light pre-holiday trade, so don't be surprised if the markets give some gains back, when they open again on Tuesday.
Good trades to all,
Regards,
Andreas
Good trades to all,
Regards,
Andreas
I am new to this game, and currently have an open position on wheat, It is a down bet and it surprised me a little the gain it made on friday, I was a bit disappointed as I had just broken through the spread into profit and then suddenly it sprang the other way. Do you think it will rise further or continue to fall like it has over last few days. Any comments/advise greatly rec'd.
Motty
Motty
The fact that it is at an all time high, does not mean it can not go higher. The longer term trend is still up, and so far the pull back after the island top, can be regarded as a correction in an uptrend. Just be cautious.
Best regards, and good trades !
Andreas
Best regards, and good trades !
Andreas
Motty,
The pattern discussed above was at the CONTRACT high for December Wheat and led to a 38% retracement (of the advance) back to the 20 day moving average. FWIW, I'm back in long for the next upleg.
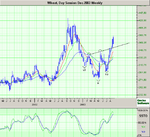
I have no idea what the all time high for wheat is, but if you look at this monthly continuation chart (i.e. not the chart of any one contract) you'll see that wheat was significantly more expensive at this time last year and was twice the price in 1996!
The pattern discussed above was at the CONTRACT high for December Wheat and led to a 38% retracement (of the advance) back to the 20 day moving average. FWIW, I'm back in long for the next upleg.
I have no idea what the all time high for wheat is, but if you look at this monthly continuation chart (i.e. not the chart of any one contract) you'll see that wheat was significantly more expensive at this time last year and was twice the price in 1996!
Attachments
On the weekly chart the neck line has been broken, which negates the reverse H&S formation.
On the daily chart prices are at the 50% retracement of the rally which started in June. The next few sessions will show if the prices can find support here. If support is broken it would mean that the longer term uptrend is over.
On the daily chart prices are at the 50% retracement of the rally which started in June. The next few sessions will show if the prices can find support here. If support is broken it would mean that the longer term uptrend is over.
Attachments
Don't yet give up on wheat!
Yesterdays' reversal bouncing of resistance at 348 1/2 is a bullish engulfing pattern confirming another one of 30/31July. It keeps the bullish scenario open. Especially, if you subscribe to elliott wave count that this low is ii of 3 up, projecting Wheat long term toward the '97 highs and short term above the August highs. One should, though, recognise the considerable resistance in the 365-367 1/2 falling window/gap.
Yesterdays' reversal bouncing of resistance at 348 1/2 is a bullish engulfing pattern confirming another one of 30/31July. It keeps the bullish scenario open. Especially, if you subscribe to elliott wave count that this low is ii of 3 up, projecting Wheat long term toward the '97 highs and short term above the August highs. One should, though, recognise the considerable resistance in the 365-367 1/2 falling window/gap.
Attachments
JonnyT,
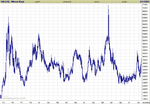
The trend is down now, as you earlier said, and from that perspective a test of the lows at 312 - 315 would not surprise me. The only thing that "worries" me here are the positive divergences in MACD and MOM, which would indicate a return to the uptrend.
The next few sessions will bring more clarity.
Andreas
Wheat , Corn & Cocoa
Dec Wheat: Trend is down but 348 is very strong support!! Also Open Interest seems to be shrinking which might abate further selling of longs. I agree with you all (Andreas, JohnnyT, Ianshep) that WZ3 can gop much lower but I do want to see a breach of 348 support.
PS. Andreas, i don't see the divergence in MOM and MACD. My charts show that they are not lower than at the previous price lows but those were much lower than today.
DEC Corn: What a sell-off!! As long as support at the 223- rising window at 223-226 holds, I can still see another leg up.
DEC Cocoa: idem above. Interesting to see OI dropping from 33k to 27k in past 6days! Is CC bottoming?
PS2 How does one upload graphs? I am using eSignal.
Re: Wheat , Corn & Cocoa
Toad,
This is what I do (works for any charting application on a Windows machine but needs Microsoft Powerpoint):
- Click 'ALT' + 'Prt Sc' buttons together (to get the screen shot of my chart into the cut buffer)
- Open a blank presentation in Powerpoint
- Click 'CTRL' + 'V' to paste my chart to a Powerpoint slide
- Crop it, draw trendlines, comments etc.
- Click 'Save As...' and choose type '.png'. (Just save the one slide, not the whole presentation, when it asks)
- In the T2W post page, 'Attach file' section, browse to the .png file.
Many other drawing applications would also do the job but I find Powerpoint the most convenient. Happy charting!
toad said:PS2 How does one upload graphs? I am using eSignal.
Toad,
This is what I do (works for any charting application on a Windows machine but needs Microsoft Powerpoint):
- Click 'ALT' + 'Prt Sc' buttons together (to get the screen shot of my chart into the cut buffer)
- Open a blank presentation in Powerpoint
- Click 'CTRL' + 'V' to paste my chart to a Powerpoint slide
- Crop it, draw trendlines, comments etc.
- Click 'Save As...' and choose type '.png'. (Just save the one slide, not the whole presentation, when it asks)
- In the T2W post page, 'Attach file' section, browse to the .png file.
Many other drawing applications would also do the job but I find Powerpoint the most convenient. Happy charting!
Similar threads
- Replies
- 11
- Views
- 7K
- Replies
- 2
- Views
- 4K
- Replies
- 1
- Views
- 5K