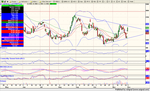
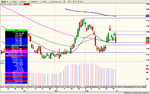
Cocoa
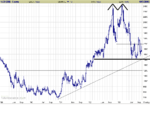
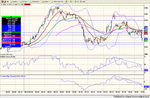
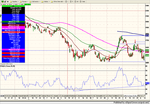
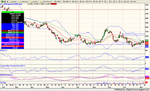
Cocoa is crashing down towards support at 1535-55, a rising window of 22/23 Sep.
I have reasonable success (read luck) trading CC riding the slide down in May and particpating in August rally. Recently I found it very difficult. Most recent trades were an entry at 1505, stopped out at 1478 (-27pts), then I wavered when CC was building base and went long at 1580 on 23 Sep and took profits at 1618 after the Evening Star of 26 Sep.
Open Interest is still going down!
Todays' trading shows there is considerable chaos in the market. I haven't read any stories.
1. Anybody out there who can shed some light on either the charts and/or fundamentals?
2. Were can one find news on Cocoa and other softs (Coffee is once again rallying!)
3. Any suggestions for on-line commodity brokers with competitive commission structures AND good access? I am currently paying $30 for a return (quite hefty for smaller contracts)
As always your replies are much appreciated.
J
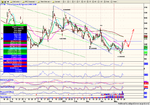
Attachments
Last edited: