DEC Cocoa

bgold

Established member
Messages
532
Likes
5
Cocoa

Cocoa is crashing down towards support at 1535-55, a rising window of 22/23 Sep.
I have reasonable success (read luck) trading CC riding the slide down in May and particpating in August rally. Recently I found it very difficult. Most recent trades were an entry at 1505, stopped out at 1478 (-27pts), then I wavered when CC was building base and went long at 1580 on 23 Sep and took profits at 1618 after the Evening Star of 26 Sep.
Open Interest is still going down!

Todays' trading shows there is considerable chaos in the market. I haven't read any stories.

1. Anybody out there who can shed some light on either the charts and/or fundamentals?
2. Were can one find news on Cocoa and other softs (Coffee is once again rallying!)
3. Any suggestions for on-line commodity brokers with competitive commission structures AND good access? I am currently paying $30 for a return (quite hefty for smaller contracts)

As always your replies are much appreciated.
J
 

Attachments

  • cc z3 1 oct.png
    cc z3 1 oct.png
    166.3 KB · Views: 582
Last edited:
There's a shortage of big players in cocoa now, so it's easy to manipulate. You can get very sharp moves without volume. If you want a broker, try Sucden, there rates were OK when I used them (negotiable).
http://www.sucden.co.uk/Login.shtml
You'll get some coffee,cocoa and sugar reports here as well.
Additionally they are active in the softs.
Good luck
 
I think it's saying stand aside young man and wait for a trend to develop.

I would sell below 1420 and go long above 1720 or 1820 but this really is a volatile beast and is hard to tame!

JonnyT
 
J,

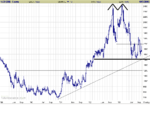
The weekly continuation chart shows a massive double top with the pattern low at 1700, giving a downside target of 1000. However, 1700 has already been penetrated upwards once, which weakens the pattern.

1400 is now THE key level. If this goes, then there is only the base support at 1200 to stop the double top target playing out. A break of 1400 will also break the three year up trend line - 'yours'.

Conversely, an upside breakout from the range at 1700-ish and we're back in the bull trend, first target the old highs at 2400.

Like wot JohnnyT says, it's wait and see time for now.

(I don't trade this so I can quite safely theorise from the sidelines!)
 

Attachments

  • co.png
    co.png
    18.4 KB · Views: 538
Ian, Johnny, Oatman,
Thank you for analysis. I see your points of view. Will study charts tonight. thanks J
 
Cocoa falling off THE cliff!

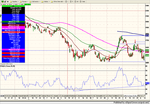
Ianshep and JohnnyT, you were both spot on! Cocoa "en route" to south of 1420 or will support at 1467 hold? Certainly some of the momentum indicators as of yet show no signs of a reversal.
 

Attachments

  • dec cocoa.png
    dec cocoa.png
    164.4 KB · Views: 529
Bullish engulfing pattern o daily chart and arguably PD on RSI!
Will cocoa find support above the July 1410 lows?
 

Attachments

  • cocoa.png
    cocoa.png
    174.2 KB · Views: 474
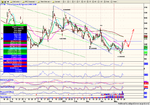
Cocoa has thusfar failed to break resistance in 1520-1540 range. Todays' reverse doesn't look very promsing for immediate outlook.

Any views or perspectives on this one?
 

Attachments

  • cocoa.png
    cocoa.png
    151.4 KB · Views: 435
Do gaps get filled?

Just as trendfollowers start seeing short trading opportunities, trouble starts in ivory coast and Cocoa shoots up by 8%!! In one day from bottom to top of triangle!!

Conventional wisdom (but not a fact) is that gaps do get filled. If Ivory coast problems prove to be minor this "mother of gaps$ ($51) is likely to be filled.

Any thoughts?
 

Attachments

  • cc h4.png
    cc h4.png
    177.6 KB · Views: 395
Last edited:
the chart was march contract. I attched post on a previous thread which unfortunately was named Dec Cocoa. Can't change title.
 
bgold said:
Cocoa is crashing down towards support at 1535-55, a rising window of 22/23 Sep.
I have reasonable success (read luck) trading CC riding the slide down in May and particpating in August rally. Recently I found it very difficult. Most recent trades were an entry at 1505, stopped out at 1478 (-27pts), then I wavered when CC was building base and went long at 1580 on 23 Sep and took profits at 1618 after the Evening Star of 26 Sep.
Open Interest is still going down!

Todays' trading shows there is considerable chaos in the market. I haven't read any stories.

1. Anybody out there who can shed some light on either the charts and/or fundamentals?
2. Were can one find news on Cocoa and other softs (Coffee is once again rallying!)
3. Any suggestions for on-line commodity brokers with competitive commission structures AND good access? I am currently paying $30 for a return (quite hefty for smaller contracts)

As always your replies are much appreciated.
J


Keystone llc oft of Chicago is around $15 a turn as is Tradestation.
 
Seems a resistance level at 1430 is forming. Last two days set up a bearish 'Harami' Candlestick formation. A Harami is a Tall bull bar with inside bar with down close to open. Possible short strategy implied between 1425 &1430?
 
The Baptist said:
Seems a resistance level at 1430 is forming. Last two days set up a bearish 'Harami' Candlestick formation. A Harami is a Tall bull bar with inside bar with down close to open. Possible short strategy implied between 1425 &1430?

Indeed the 1430 level represents considerable resistance. But it also be argued that a bottom is forming.
1. pos divergence in various indicators incl RSI
2. Commercials are adding to net long positions
3. calendar spreads are coming in although only ever so slightly.

RitaSam, thanks for tip on brokers. I am investigating Tradestation who use the same RJO Brien platform but at 50% of current commissions. (and that pays handsomely for the fixed tradestation platform costs of $99.95)
 

Attachments

  • cc.png
    cc.png
    263 KB · Views: 357
Fair comment, especially if feeling bullish. My comment was more specifically directed at the immediate next day or so. And the candlesticks of the last two days made a clasic short term bear pattern, I am currently teaching myself the finer details of Candlesticks so have been scanning for such.

The nice thing about resisitance is that it could just as easily be support so the full suggested view should maybe have been short 1425 - 1430 stop and reverse to long 1435 -1445 range. Cuurently market down to 1376 on the july

I hope it works for someone.
 
Being short from 1425 would certainly have been a very good trade! Closing at 1367 is not exactly encourageing for the bulls.

You write that you scan for candlestick patterns? May I ask if and which program you are using? Is it reliable?
Thanks
 
Scanning the market...

Hi Bgold,

I misled with the word scan, at this point I am merely doing a visual look over all commodity charts. Very quickly i can identify if there are any set ups of interests. hence the observation on Cocoa merely for technical reasons.

When I first joined the board I was hoping to pick up a programming fundi who could describe (MS code) my desired set ups, even if a small fee was required. I currently use MS9.0 but gave up TS2000i a couple of years back after not showing the aptitude/inclination to write the code.

It is currently my greatest failing that I still do manual searches when machines could do this better, It is down as an objective to crack, if any out there feel like a challenge.
 
Top