Deadline June

Finally get something that's looks worth paper trading

Got to the point yesterday where I was getting seriously worried that I wasn't going to find anything useful. I think what I had been doing was not so much 'optimising', it would be better named 'pessimising' it. That's what it felt like. It always feels really bad to throw away a strategy/trading system, but I had to do it, it was dead in the water, floating upside down with a distended belly.

I spent a long time looking at candle stick patterns and I like the idea behind them so I tried different types both as a filter to prevent or trigger a trade, and as a trigger to ditch a trade, e.g. if I'm long and a bearish Harami pops up, exit at the mkt.

All of the stuff I played with didn't come to anything though. I'd focus on a particular chart and get the strategy to get me into or out of a trade perfectly during a particular little bit of price action.

Of course that kind of trigger didn't work a lot of the rest of the time.

The next thing I found after lots of tinkering actually appeared to come up trumps. I put a volatility filter on the buying and selling, just to stop it completely for periods at a time, and remarkably that did the trick.

I'd love to post my exact strategy here, but I'd also feel really uncomfortable doing it, I guess it's just my natural possessiveness - despite old Richard Dennis saying you can publish your system on a whole page advert in the Times and no-one will be able to use it properly. Actually I don't believe that's true these days.

So here's what I got from NinjaTrader's walk-forward process, from 1998 to end of March using 28 day periods optimize & walk-forward - this is the walk-forward totals on 8 pairs on 60 min bars.

Code:
[FONT="Courier New"]Performance	All Trades
Total Net Profit		$1,753,529.58
Gross Profit			$10,229,250.26
Gross Loss				-$8,475,720.68
Commission				$564,733.00
Profit Factor			1.205
Max. Drawdown			-$1,534.23 (per mkt per month)
Total # of Trades		110175
Percent Profitable		47%
# of Winning Trades		51386
# of Losing Trades		58789
Average Trade			$15.92
Average Winning Trade	$199.25
Average Losing Trade	-$145.15
Ratio avg. Win / avg. Loss	1.39
Largest Winning Trade	$13,573.94
Largest Losing Trade	-$6,215.20
# of Trades per Day		25.68
Avg. Time in Mkt (mins)	183.85
Avg. Bars in Trade		2.35
Profit / Month / mkt	$1,435.74
[/FONT]

And despite the huge amounts of processing that NinjaTrader did, there's still a lot I don't know:

- drawdown across all 8 pairs
- length of avg & max drawdown in days (both per pair and per basket)
- number of simultaneous trades in different pairs
- correlation of returns between pairs

all pretty important info for working out how much leverage to use and how much capital i need.

So what I need to do is extract the trade info from NinjaTrader - which I could do manually but that means something in the order of 5000 copy - paste operations. I should be able to do this by code.

In the meantime I guess I can run it on the paper trading account.

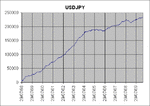
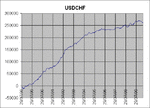
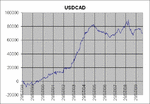
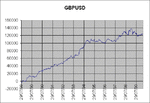
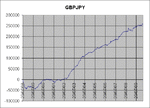
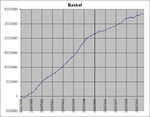
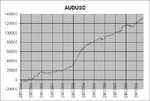
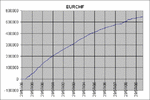
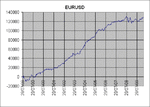
Here's some pretty graphs in lieu of stats like Sharpe Ratio and max profit / drawdown.
 

Attachments

  • MyHTML1.gif
    MyHTML1.gif
    10.3 KB · Views: 166
  • MyHTML2.gif
    MyHTML2.gif
    11.1 KB · Views: 161
  • MyHTML3.gif
    MyHTML3.gif
    10.9 KB · Views: 181
  • MyHTML4.gif
    MyHTML4.gif
    10.7 KB · Views: 155
  • MyHTML5.gif
    MyHTML5.gif
    11 KB · Views: 162
  • MyHTML9.gif
    MyHTML9.gif
    13.8 KB · Views: 146
  • MyHTML8.gif
    MyHTML8.gif
    11 KB · Views: 166
  • MyHTML7.gif
    MyHTML7.gif
    9.8 KB · Views: 186
  • MyHTML6.gif
    MyHTML6.gif
    9.6 KB · Views: 148
Last edited:
Good stuff Adamus. I have followed your thread with interest whilst plodding on facing similar problems with data handling and multiple variables and curve fitting; though my weapons of choices are excel and IG backtest facility, also only look at either FTSE or EURUSD working a basket as you do is beyond me.

I also discovered recently that whilst the use of various TA's does not seem to improve things the addition of a volatility filter is the single biggest positive impact I have come across. The dilema I now struggle with is that as the filter is my own there is another period and range varable to optimise.

Good luck as you move into the next phase of paper trading and hopefully to meet your original deadline.

KD
 
hi krapdad

the deadline is looming, big style. Thanks for the encouragement. Just found out my new pc should arrive tomorrow a couple of days ahead of the given delivery date, so that wins me a bit of time :) - I'll have one pc for research and one for paper & live trading.

I had the same dilemma myself with having an extra variable to optimise. My solution is a bit simplistic and you'll probably find your own better way of doing it, but I just decided to use one variable for time period / length.

e.g. if I add a new piece of code that requires the length of time in bars, I just use that one main one I have. If I then add another, I still use the same variable. So I could have a volatiility measure over x number of bars, a moving average of price over y bars, and a stop range based on z bars - but I make them all the same, i.e. x = y = z.

Originally I thought it might reduce curve-fitting, but then I found it also radically reduces the amount of number crunching I have to do.

I liked the idea too. Thought I was getting quite smart for a while. Everything is short term, or medium term, or long term.

In fact for the same reasons I did something similar with the slow moving average I used to compare the fast moving average with. The fast one is x, and the slow one is always 150% of x.
 
Thats it then, can you believe i am using two MA's one for reducing position or building position by 1 bet and another for changing the direction of the bet totally regardless of the size of the position. Optimising both around 21 and 23, I'm going to use 22 for both, i know it makes sense.

With four variables in total one cannot make sense of the daily result table with 100 scenarios because of the interdependancy of the variables. I've been clinging to the curve fits at the top of the results tables for too long knowing it is wrong. Surely our systems must be robust enough to stand such a small variation in MA periods otherwise we are curve fitting.

Thanks for the push, I'm in the minimum variable camp from now on. May even change the volatility period to the same as the entry/exits aswell.
 
Krapdad

Go for it. I hope you get somewhere with it quickly, and may your results be robust and perky :jester:

I really want to say "and may your curves be fit!" because it sounds so good, but actually, that wouldn't be so good :(
 
Now what?

Suddenly all I've got to do is sit here and look at the screen.

The question is, how long do I leave the trading systems running in simulation? I guess my June deadline is the first factor to consider - I need money for the rent on July 1st. I could find some more living expenses for another couple of months if I needed to desperately but I think it's better to leave that as a fall-back in case things get nasty.

So that gives me 8 trading days, call it 10 to make it a round number. What are 10 days of simulated trading going to show me?

- firstly that I can get the whole mechanical trading system working without orders firing off at random and fills getting lost over the ether. I'm sure InteractiveBrokers TWS and NinjaTrader have the capacity to lay my carefully made plans to waste.

- secondly, I should be able to confirm the margin calculations. I'm short 100,000 EURCHF and I see £22,987 in the initial margin column. Big blind spot that I need to stop ignoring :eek:

- 3rd, I can check the fills I'm getting to see that the slippage I'm getting is less than a pip per execution - which is what I used in back-testing. With the limit entry orders, I hope I won't get any real slippage but with the exit stops I expect some. The problem is this is actually only simulation and I think the fills from the simulator on the IB server are probably not representative.

- 4th: the system should work as it does in back-testing. Apart from slippage, the orders should go in where they're meant to and the whole trade history should be exactly the same in simulation as it is in the back-test.

I've got a ton of work to do already to put the statistics together for the performance of the system in the optimised back-test, and then again for the performance in the walk-forward. The performance in the walk-forward should be comparable to the performance of the simulation.

And then the leap of faith: the performance in live trading should be comparable with the performance in simulation. The stats should all be in the same ball park. While I'm bound to take a performance hit of anything up to 50% compared to the averages across the back-test history, the first month of live trading should have statistics that would fit into the range of the back-test statistics.

So all the work: outputting the back-test history of trades from NinjaTrader and putting them through the Java app I wrote.
 
Last edited:
simulated trading

Setting up Ninjatrader to run the trading system was easy. Way too easy. Ignorance is bliss. There are about 10 different options to be configured which influence the way that Ninjatrader runs the strategy, when it starts it, when it stops it and when it gets disconnected and reconnected.

Since IB TWS lost its connection about half a dozen times yesterday, I don't know why, maybe just too much chaos going on in the forex markets - Ninjatrader went haywire with the orders and positions. It was like the Sorcerer's Apprentice.

This is why they have simulation accounts.

I eventually worked out what all the different configuration options do, at least in theory now, so I'll be checking what goes on over the next week and a half - watching the positions, the orders, the executions and the account balance.

The account balance is very interesting. I can only describe InteractiveBrokers' margin framework as 1/10 logic and 9/10 jiggery pokery (in the best sense of the word, of course).

Hopefully with everything configured as I intend it to be, things should run more smoothly next week and I'll be able to grasp how IB are doing their stuff. No doubt it's useful otherwise they wouldn't do it like this. The magic incantation to evaluate the state of your forex account is apparently as follows:

When determining the amount of funds available for trading purposes, margin is required only on negative net liquidation values. The margin requirement is calculated as follows:

1. Determine the base currency equivalent of the net liquidation values in the account.
2. Determine the haircut (margin requirement) rate for each currency pair.
3. Sort the haircut rates from lowest to highest.
4. Determine the largest negative net liquidation value.
5. Starting with the positive new liquidation value base currency equivalent with the lowest haircut rate, calculate the margin requirement on that portion which may be used to offset the negative net liquidation value.
6. Repeat steps 4 and 5 until all negative net liquidation values have been offset.

I'll have some fun over the weekend going over their examples.

This is all bad enough on its own, and I'm not complaining here because I quite like the stress, but the emotional impact of seeing all these profits and losses ticking over (even in simulation) made itself felt - and add to that the hassle with the new PC which arrived and needs to be sent back because of various problems, it all meant that I didn't do much today apart from drive my toy firetruck around.

I decided I definitely need a graph of the distribution of daily returns. It's weird seeing £3000 profit one day, and then £3000 loss the next, while expecting to average about £15 profit per trade.

7 trading days to go . . .
 
ninjatrader 7 beta

NinjaTrader released NT7 beta-16 on Thursday and almost instantly regretted it as four or five traders lost the ability to trade and came onto the NinjaTrader support forum demanding downgrades back to beta-15 which wasn't available on the website anymore.

Fortunately for me I wasn't affected by it because I didn't upgrade but now they've pulled down the beta-16 installation site and there's no NT7 installation available at all, which is a bit inconvenient because I've got my hot new computer with Win7-64 sitting on my desk ready to go.

The poor traders who got foobarred by beta-16 apparently lost their set-ups and strategies and portfolio lists even. Not fun. I'm slightly worried now that with one upgrade NT might take out the historical data I spent days importing. Still that wouldn't be such a tragedy since I've got what's most important backed up - the strategy scripts.

I've also got an amusing situation with the EUR.CHF. Since I split my trading systems into seperate long and short systems, it means I run the trading system twice for each forex pair - one long, one short. Since I optimised them seperately, it means that they may be trading on different moving average lengths and in fact on Friday I went long and short EUR.CHF so I've got 2 positions on. Even more amusing, they're both in profit.

Shame it's just simulated.
 
boring details

That's a message title to put off the traders and to excite the accountants and administrators out there reading this.

The NinjaTrader beta 16 is now up and running on two machines, one for executions and one for backtesting (paid £100 odd quid for the license for 3 months).

The executions (as in IB Simulated account) NinjaTrader is running simulated trading with my 2 strategies - that's 1 strategy running long and short seperately on one currency pair (the Holy Grail trading system I mentioned before - I can't work out whether to call it "Holy Grail" officially or just to call it "Leprechaun" after the little green man who gave it to me)

- plus my main strategy running long and short seperately on 10 currency pairs.

I think I've tried every different option and combination of options for running NinjaTrader strategies and I have sorted out the configuration that suits me - all a bit mindlessly small details but the effects can be dramatic - there's one option to let NinjaTrader try to 'synchronize' the trading account with the trading strategy.

For example, imagine the account base currency is GBP and the value in the account is 1,000,000 - this synchronization involves NinjaTrader attempting to flog off all the base currency because it thinks it should be in dollars and the strategy should be 'flat' GBP. That was a surprise when I saw the order go through (at the market!).

Let's just say I don't think I need that option :jester:

I also discovered the settings to tell NinjaTrader not to give up trying to get prices when IB TWS goes AWOL for a while. Default 'give up trying' setting: 5 seconds. Not exactly diligent.

In other fascinating news from the Adamus trading desk, while all around currencies crumbled and empires rose and fell, I worked out how to script NinjaTrader to output the trade information so that I can import it into my Java app and run my home-rolled risk analysis and risk charting on the results. Hooray! Back to coding in Java to get my old app to import real timestamps instead of just yyyy-MM-dd.

Java is what I do best - oh hold on, I think I mean, Java is what I like to do best - slight difference. This will probably mean having to fight the tendency to code up loads of nice-to-haves.

To try to control myself more, I have chucked out the baseball bat of management and replaced it with the Pomodoro Technique which involves nothing much more complicated than working flat out for 25 mins, timed by a Pomodoro (an Italian kitchen timer shaped like a tomato).

But what I am looking for is more stats on my trendfollowing strategy - charts for the distribution of returns on a daily, weekly and monthly scale, a maximum margin calculation of the combined basket of currencies, a maximum exposure to the USD - although I've no idea how I'm going to program that.

Meanwhile NinjaTrader is ticking away on the backtesting machine outputting trade info to file.
 
more boring details: IB currency balances and margins

I'm now becoming more familiar with the IB account in general - at least the Reg T account.

One of its main features, although I guess most trading accounts are like this, is that the base currency for the account is just one currency that can have an overnight balance. Since I'm trading AUD, CAD, CHF, EUR, GBP, JPY and USD, my simulation account now has balances in all of them too - not just when I've got a trade position, but ongoing, so I could split my balance across all of the currencies equally as a kind of hedge against the GBP.

Another feature of the IB forex trading facility is that I don't have to close a position in the diametric opposite way to how I opened it. ie if I bought GBPUSD, and then EURGBP, I could go flat just through selling EURUSD.

That's pretty cool technically IMHO but it means it throws the whole position column figures out of whack on the individual ticker lines. I haven't figured out how IB TWS does it yet, but if I did that 3 leg round trip above, at the end of it I would be flat but the GBPUSD, EURGBP and EURUSD ticker lines would think I still had positions on.

I haven't figured out how much interest I'll be earning on all the currency balances when flat & evenly distributed across all 7 currencies - nominal, probably or perhaps even notional ;) but if you don't watch out, IB TWS will let you hold negative balances in your account and will charge you interest on them, at the base rate + 0.5%. Of course they pay you interest on your positive balances, at the base rate - 0.5%.

The question is whether it's worth the commission to exchange an amount from another currency to cover it.

I guess I should work out whether it's pennies or substantial amounts that it would cost to manage.

[Edit: I asked IB about the 'positions' that TWS remembers and it's easy to set these back to zero using one of the right-click options]
 
Last edited:
Just decided that my avatar picture is actually a woman.

So just in case anyone thinks my avatar's sex is the same as mine, I'm going to go off and find a male picture. All carefully timed by my pomodoro.
 

Attachments

  • klee6.JPG
    klee6.JPG
    42.8 KB · Views: 199
I am currently struggling to code up the analysis of intra-day trades exported from NinjaTrader. I've got quite a lot of code that relies on the trades being time-stamped for midnight which was fine when analysing EOD trades.

Reading T2W is so much easier :jester:

This is the last stretch to cover, before I make it to the rocket.
 

Attachments

  • tintin_rocket18_.jpg
    tintin_rocket18_.jpg
    3.4 KB · Views: 475
Are you sure about IB only charging base+0.5 for overdrawn ccy balances, this sounds too low to me.. I seem to recall asking them this and was told base+1.5. Thus if you were (for example) long GBP/USD, you earn 0 on your GBP and pay close to 2 pct on the USD, net charge of 2 pct.

This is co-incidentally exactly the same roll charge that spreadbetting companies charge per annum on open FX positions overnight (please note this has nothing to do with the interest rate differential, it's simply a charge above and beyond that).
 
They charge 4 different tiers on USD:

< 100,000 BM + 1.5%
< 1,000,000 BM + 1%
< 3,000,000 BM + 0.5%
> 3,000,000 BM + 0.25% (or 0.5% total, whichever greater)


IB interest charged

I triple checked what I wrote against their webpage just now.

I don't know what it is about IB but in all their documentation they have a knack of making it easy to confuse. Their Java API documentation is horrible. I haven't bothered reading any of the risk disclosure statements (all 50 of them).
 
Last edited:
More on IB's carry-over charges:

Interest is calculated at IB only with settled funds so after the trade has settled, that day after 17:00 EST (New York time), the interest is calculated.

If the position was opened and closed before 17:00 EST (or both positions traded after 17:00 EST) the answer would be no. However, if the position is opened before 17:00 EST and held then closed after 17:00 EST, you will be subject to one days interest due to the difference in the value (settlement) dates which are 2 business days after the initial trade in spot trading. There is one very important exception in which a trade that is open after 17:00 PM EST in which the value date has a three day extension (since commercial banking does not occur on Saturdays or Sundays) in which the interest from the value date includes the weekend days.

Since 22:00 GMT is 18:00 EST and 0700 GMT is 03:00 EST, the answer is there will be no interest charged on that trade by IB since the value dates will match.
 
Rite, so for all intents and purposes the overdrawn rate is 1.5 pct above base, unless you are doing chunky size. But if you were, why would you trade FX spot when you can just do futures.. futures have zero roll charge. That's the path I've gone down.. I used to do most of my FX biz on IG (as spot) but the daily pip penalty was annoying so have now started doing some FX on futures. Obviously the IB stuff won't be tax free, so it's another factor to throw in.

I'm impressed by the level to which you are researching all this.. most people don't appreciate the difference between interest rate differential and overnight roll charge, for example.
 
[Edit: ok this is a ****-up so anyone reading this next paragraph be aware: in the next paragraph I meant the arbitrageurs will cause the interest rate differential seen in the forex mkts to appear in futures too. The roll charge is another matter.]

Futures may have zero roll charge - but it's definitely arbitraged in by traders operating in both markets. I guess if you're operating a trading system based on backtesting, then you've already factored that in.

I've not forgotten about tax. But I have to earn more than £6,500 p.a. first :)
 
Last edited:
Ah, this is not what I mean.

1. Roll charge = the 0.5 + 1.5 % = 2 % that IB (and IG) charge you for the pleasure of trading FX spot. When you have an open position, you are earning interest on one side (charge there is 0.5 pct) and you are overdrawn on the other side (charge there is 1.5 pct). Thus 2 pct charge, per annum.

2. Interest rate differential = simple mathematical formula to calculate the forward points. E.g. if AUD/USD is trading at 1.00 (just an example), AUD rates are 5 pct and US rates are 1 pct, then the differential is 4 pct, thus the 1yr outright forward rate will be 0.96 (the future value of AUD is discounted by more because its interest rate is higher). So in the futures market, the 1yr future will be around 0.96, whilst spot is 1.00.

1. and 2. are totally and completely unrelated in any way, but are regularly mixed up. By "roll charge" I mean 1., which is an invented penalty on the customer. (It could be 1.5, 2.0, 3.0 or 5.0, whatever IB/IG/CityIndex etc want it to be).
 
2. is set by the respective central banks of the countries, and they do not communicate with the spreadbetting firms!

Tradefair used to have a roll charge of 1 pct or so but recently raised it to 2 pct, to fall in line with IG and City Index.
 
Top