Deadline June

less than 24 hours after total defeat...

That is it: it only took me less than 24 hours from total defeat to do the whole thing all over again. I formatted, reinstalled xp, reinstalled all HP drivers, all windows updates, did an acronis image, and now here I am, about to watch the Mulholland Falls movie all over again to make sure this time things go ok. If they don't, then it's a hardware problem - no doubts about it.

http://www.megavideo.com/?v=8SXNEOMF

Once I'll be 60 minutes into the movie, I will know the problem is solved. And then there's no way I am deleting this last acronis image: never, ever. Nope. I might create new ones, but never delete this image of a perfect brand new xp and drivers.

Oh yes! 33 minutes into it... it's definitely working.
 
Last edited:
You mean Mulholland Drive - David Lynch & Naomi Watts? I liked that. A long time ago, but I liked it I think. Once I'd stopped puzzling over it. Along with Lost Highway, and Twin Peaks of course.

Talk about puzzling, I'm trying to work out how I got filled outside the bar 3 times in 4 trades by IB. Once in my favour, twice in someone else's favour. In fact one of those bad fills was slippage of 8 whole points in the EURCHF.

Theoretically though I don't know whether that would be slippage against the trading model I backtested, because that was disktrading data and this is IB data, so it could just be really bad data.

Maybe I should stick to the EURUSD.

And this is what was once the Holy Grail. If you read above, you'll know I downgraded it to the Holy Mug. I'm not quite sure where I can go from here - perhaps just the Holy Disposable Polystyrene Cup would be the best moniker for the system. Or 'The Holy Slippage Container'. I doubt Batman and Robin ever got slippage like this.

It could also be the time frame. Perhaps I shouldn't be messing around down at 15 mins bars.
 
No, "Mulholland Falls". Look:
http://www.letmewatchthis.com/watch-3781-Mulholland-Falls

I don't like David Lynch very much.

What I can tell you about IB is that they don't rip you off. It never happened to me. Oh, and please don't badmouth disktrading, because I am a big fan of them.

I am also a big fan of 15 minute bars. Once again, as I said a while ago, my advice is to build very simple systems, like the one I showed you in a private message. I stress out the importance of time of the day. At a given time of the day certain things tend to happen. Like volatility and reversals.

Also, don't look for a big edge, because then, in order to get it, you'll overoptimize, and then the system won't be reliable. 60% of wins is good enough (with wins the same size as losses).

Regarding time of day, I plan to put my trade histories into graph format to show the temporal profitability variations. It's on the list of things to do. When you're exploiting stuff like that, do you use stops? Or do you just put in the time targets and wait? From some of the stuff you've mentioned, I get the idea you're not using stops.

At the moment I am trying to adapt my Holy Disposable Polystyrene Cup system to use limit orders only - with stops in case the limits fail.

And thanks for the warning on overoptimisation. It's good to be on your guard against that - constantly!
 
Yes, correct, I am not using stops and i have only time based entries and exits. Things are much simpler that way, and no danger of optimizing that parameters (LMT orders). The simpler the better.
 
Spent hours writing a fantastic algorithm to chart distribution of returns, wrote tests to check it worked, and then the final result: what's that?!? :mad:
 

Attachments

  • returns.png
    returns.png
    11.2 KB · Views: 199
Just a marker for the passing of another lost weekend mired in the depths of some old technical problem or other - it's performance this time. The db on my java app declines to be 'performant' anymore, and my db admin skills are as ropey as really ropey old rope that's been used to moor a dinghy in the City Road basin but which actually sunk during the war, got tangled in the prop shaft of a passing canal boat and was keel-hauled from there to the Norfolk Broads and back again. And subsequently suffered an attack of exotic Japanese killer barnacles, was fished out and used to stuff a cow in a Damien Hirst exhibition. It's that ropey.

Suffice it to say I'm now going to concentrate on something else, hopefully interesting - like NinjaScript - until someone from MySQL.com answers my plaintive cries for help. And yes, if you know anything about DBs then you probably know more than me but I did put indices on all the primary and foreign keys.

I'm going to play in NinjaScript and try to come up with some code to replace my exit stops strategy with a limit order and a lower stop. My theory is that, if I get the position of the new limit and stop in the right place, I can get a system with the same profit, but half the exits will now be limit orders instead of stops, and therefore saving me half the slippage or about $5 per trade (on 100K forex trades).

Considering that my trades on most of the systems I come up with nowadays average $15 dollars profit per trade after transaction costs, this could be useful.

Pessimistically though I doubt I can do it. If my system says to exit, then logic tells me that the market is most likely to be moving against the trade, so it won't take the limit exit, it will take the stop.

BUT since I currently favour using a parabolic trailing stop, in many cases the stop is just zooming up to meet the market, so perhaps this idea might bear fruit.
 
the deadline is here

This is actually not a very nice feeling, thinking I might not make my deadline. It's pretty much the same sort of feeling as losing.

Anyway, some interesting charts: one is returns in money, the other in %, both the same data. I can see now why so many people use % as their measure of return.

This is my Holy Disposable Polystyrene Cup System.
 

Attachments

  • profit_money.jpg
    profit_money.jpg
    57.6 KB · Views: 202
  • profit_percent.jpg
    profit_percent.jpg
    62 KB · Views: 187
Is that graph for a purely mechanical system? If so, you're onto something fairly amazing, it looks like a licence to print money. Are you 100 pct sure you've coded it properly, i.e. have not allowed for "illegal" trades (selling at high of day for example).
 
hi mr,
it's coded correctly, but it's not nearly as good as it looks. the graphs are without transaction costs.

also, this only works for one currency - EURCHF, and only long, not short trades.

also, note the way it tails off at the top. with transaction costs of $20, it actually lost money this year.

i call it my Holy Disposable Polystyrene Cup.

I'm trying to reprogram it with less stops and market orders, whichi is where all the slippage comes from. I traded it last week and found the slippage / transaction costs were around $20 (actually CHF20).

I was quite surprised that the slippage was so consistently bad. I thought it would very a lot more. I guess I should be grateful. Unless of course it just varies very slowly.
 
My system looks at 10 markets, but EUR/CHF isn't one of them. It's far too manipulated for my liking, and goes from 0 to 100 in about 2 seconds when the SNB get involved.

Do you think you are on course to get ready by June 30?
 
''i call it my Holy Disposable Polystyrene Cup.''

That's a hilarious comment Adam ;-) Made me laugh.
 
Sorry, it's the line from the third Indiana Jones film where the old knight dude comments on the choice of cup as Holy Grail.
 
Death by Ninja

Like I wrote a couples of time before, I am using NinjaTrader 7 beta, which is like getting to spend the night with Claudia Schiffer, but only when she's had a brain transplant with Jeffrey Dahmer . Don't read that link unless you like getting the creeps.

Since the software is in beta testing, I can't complain. I can't however really use the previous version on account of its bugs that prevent me loading the historical data I have. I could have gone with TradeStation I guess, but I thought I'd risk it and take my chances with the beta software.

Apparently it's in the 'stabilisation' phase at the moment, they say.

To achieve my goals by my deadline (whether I do or not might be debatable...) I made a plan to run this software live with my trading strategies.

A couple of the things that make me really worried:

- starting up the software on the new PC I bought for it crashed it a couple of times
- starting up the strategies/trading systems on a couple of occasions caused immediate "overfills" where the system allows 2 trades to execute by mistake so putting on double the position sizse.
- sometimes the systems just won't start up and go into a state of suspended animation
- even with comprehensive logging programmed in and going over the results order by order, comparing a live day against a backtested day, I don't feel happy.

So

watch
 
Last edited:
Hi MR, it's going, but not too well. I feel like Houdini on a bad day. I know I can get out of this situation successfully but I've got to convince myself that I can trade what I've got, and I haven't got the Holy Grail, I'll tell you that.

I spent ages writing code to output various bits of risk analysis stats on the backtest results and now I wish I hadn't. I don't know whether it's easier knowing how badly the poo can hit the fan, or whether the ignorance of not knowing was perhaps more blissful.

I wasted stacks of time over the last 2 weeks doing stuff I didn't need to with NinjaTrader, making what seemed like simple changes which led down paths of total disruption. I've been trying to steer clear of writing an "all-encompassing" solution in NinjaScript for dealing with their backtesting, simulated and live trading order, execution and event model, but some of the hoops you have to jump through are too much, especially when one support staff member says "do it this way" and another says "do it that way".

For a long time I found that posting here what I do as I do it really helped, but recently I guess the stress has got to me a bit more and the noise on the forum began to drown out the benefits I was getting from it.

In short, I ran a system 3 weeks ago and was really unhappy at the fills on stop and market orders, so I changed my system so that I have about 30% less stops and no market orders. It's dependent on braketed limit and stops orders on minute bars and it almost blew my mind trying to get 2 time frames working in the same NinjaScript strategy. I was on the verge of ordering the acme do-it-yourself lobotomy kit on Monday, but I finally managed to suss it out yesterday.

Plus NinjaTrader support staff then revealed in passing that you can actually update orders on IB rather than cxl & replace, so of course I had to reprogram my script to do that because the compulsion of the software developer in me was too much. Can't really blame NinjaTrader's support staff, they're actually really good, but it makes my deadline a bit of a joke.

So really Deadline June as a military operation has been blown out - I withdrew a grand and a half out of the trading account for my July expenses but with the excuse that it looks like the trading action is really about to begin.

There'll probably be some more Death by Ninja to suffer, but I'm on top of the learning curve now.
 
I nailed down the transaction costs - slippage and commission - on the two strategies I'm working on. I think realistic level is for every round-turn is 0.00024 or 24 currency units per 100,000.

I base this on:

- 0.4 ticks commission
- 3 ticks slippage on stop orders, which only make up 1/3 of the strategies' executions. The other executions are limit orders. So that's 1 tick slippage on average per round-turn
- 1 tick just in case because of stuff like the spread (I buy at the ask and sell at the bid, but my tick data is based on reported trade prices).

Saying that this is conservative is a bit of a joke, it's not conservative at all, but the higher the transaction costs, the more my results tend towards longer term systems. But using anything unrealistically low for transaction costs leads to high frequency systems which are unrealistic unless I was working in an HFT set-up.

My Holy Grail would be a system that shows results (across a basket) with mostly positive monthly profits and a profit per trade of about $25 over and above transaction costs.

So what I have at the moment is still a way's away from Holy Grail status.

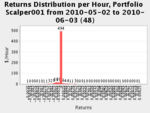
My Scalper2010 system makes simple 1-bar-only style trades on the hourly timeframe. For long trades, it buys at a limit set at the min of the previous 3 lows, and it exits at the end of the bar using a limt & stop order bracket on the 1 min timeframe.

If I didn't filter the trades I'd get about 3 trades a day. So I'm running through all the different types of filter I could use to see if anything works, alone or in combination, e.g. MA[0] > MA[1], high overlap, low negative volatiliity / positive volatility, ADX, low candle length / ATR, bullish Haramis (or no bearish Haramis)

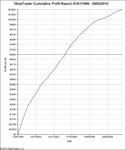
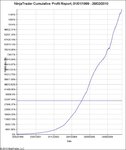
Scalper2010 on the EUR/CHF is my Holy Grail, almost - without any filter. Just entering and exiting. The only problem is that it fails badly every year for a month, and it seems to have failed completely every month this year, bizarrely (or Sod's Law perhaps). Its equity curve looks more like a stock market chart than an equity curve. It's interesting to see why, looking at the different market behaviours during those periods.

The other strategy is called with great originality "TrendFollower". It's a mean reversion system. OK, OK, it is actually a trend follower.

It uses limit order entries like Scalper2010 but with a different trigger using volatility, sometimes a whole ATR for the timeframe, sometimes a factor of 0.5 depending on market behaviour. I've been dividing up the market behaviours into different types defined by its own algorithm.

For instance, a rampant bull or bear is defined by consecutive big candle bodies with small or no overlap. These occur more and for more bars on the 60min timeframe compared to daily, but they still only last for relatively short number of bars, normally 3 or 4 and then the move is over, so I identify these market types based purely on the last two maybe 3 bars.

Again like Scalper, I set filters, often based on the same market type definitions.

As for exits, I use a parabolic trailing stop, which is hit approx 1/3 of the time, and when it gets close, I replace it with a limit / stop order bracket which forces the exit. I guess I throw away some potential for bigger moves picking up again, but I think that's too infrequent to worry about and the bracket exit gives me a 33% chance of a limit order exit with no slippage.

So those are my lego bricks and I get to play all day at putting them together into trading systems - at long last after struggling with NinjaTrader and NinjaScript for so long.

Today I'll devote half my time to each, just looking at price action in the charts and creating algorithms to fit market behaviours, backtesting and re-backtesting. (Yes I know I use the word fit and the alarm bells went off, but it's not curve fitting, it's identifying market behaviours, perhaps 4 or 6 max across all markets).

It's not all rosy in the garden though - I've blown through my deadline and the first thought in my head when I wake up is "I don't have a working system". So it really feels like I'm looking for a break-through now on the system development, which has replaced the confidence that I'd be bound to find something. If it gets to the weekend and Thurs, Fri and Saturday haven't brought anything useful, it's going to be a time for tough decisions again. How many times have I been here before? I'm going to go and ponder that over a coffee, and wrack my brains to make sure I haven't forgotten something fundamental that cost so much to learn.
 
I've changed my approach for inventing trading systems now that I have mastered NinjaTrader.

Beforehand I was realising the impact of my ideas via the results of backtests, looking at the dollars per trade, the drawdown and the equity curve. I would combine all the different algorithms I knew in an attempt to try all combinations of everything I thought might be useful, e.g. putting together a new filter with an old one and the different entry price algorithms and exit triggers.

This approach only got me so far and in playing around in NinjaTrader I discovered their automated walk-forward function which actually produced what looked like a tradeable history straight off the bat. The problem with those results though was the transaction costs were too low and I can't use it as it is, and trying to optimise it more just ran into the sand and got me to the point where I didn't have the profits I wanted and I thought there was a danger of curve-fitting even on the out-of-sample results just by doing so many of them.

What struck me as weird was that the trades on the chart seemed to be at random and I really couldn't see visually what my algorithm was seeing.

So to follow on from what I wrote yesterday, the way I'm approaching development of systems now feels a lot more logical.

I'll start off with the basic skeleton, e.g. the Scalper2010 without filters. This is really simple because I only have to find filters for it - I can leave the entry and exit mechanisms out of it unless I really hit a brick wall with the filters.

Then by looking at the equity curve, I can see where the profits came and where the losses were, and then refer to the trades on the bar chart to compare the two periods.

The easy stuff will leap out at me from the chart. If it's doing really well, I'll see the combination of price action and entries and exits, and usually I can define what that price action was, e.g. there's a lot of overlap between candle bodies and it's consolidating.

I can also see from the equity curve which periods were really bad and then from looking at the trades on the bar chart, I can see what the market was doing and define that behaviour.

Of course none of it is perfect and there's always an annoying "trade" that I want the system to do to take advantage of a big move but which just won't co-operate.

Basically there are 3 types of trade from the backtesting: (1) a good trade I want to keep, (2) a bad trade I want to prevent and (3) a virtual trade that I can imagine but which doesn't happen.

To start with my algorithms really produce results and push the backtest profits up and drawdowns down, but then making that last little bit extra which makes the difference between a tradeable system and a banana is always the impossible part.

What I gain in one time period I actually find I've lost from another, or what I achieve in one instrument produces worse results in the others.

So today, more of yesterday. Hacking and scripting and pondering bar charts and equity curves. I think the trick, for productivity, is not to focus too much or get hung up on any particular details. I just have to remember it's all going to be mixed up and thrown back at me completely different by the future, with knobs on.
 
Top