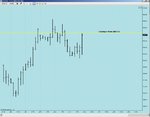
USDJPY (Rolling Spread)
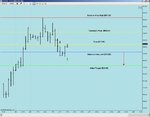
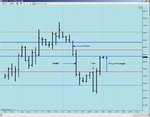
I've been stopped out on the remaining 1/3 of the S&P trade for a loss of 7.00 points.
I now review whether the market is back in balance at the close of business.
Meanwhile,
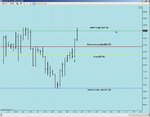
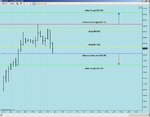
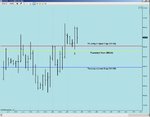
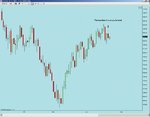
USDJPY
Sold @ 100.10
Stop @ 100.40
2/3 Target @ 99.65
1/3 Runner
Have just been filled on the initial target for 2 units x 45 = +90 pips profit.
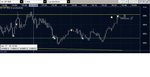
Whereas with ES I'm finding that using a 240 minute chart provides clarity in a volatile market, I feel that the same timeframe removes too much detail and makes the stops uncomfortably large for USDJPY.
Therefore the attached chart is an hourly, with the trend defined by the channel.
I've been stopped out on the remaining 1/3 of the S&P trade for a loss of 7.00 points.
I now review whether the market is back in balance at the close of business.
Meanwhile,
USDJPY
Sold @ 100.10
Stop @ 100.40
2/3 Target @ 99.65
1/3 Runner
Have just been filled on the initial target for 2 units x 45 = +90 pips profit.
Whereas with ES I'm finding that using a 240 minute chart provides clarity in a volatile market, I feel that the same timeframe removes too much detail and makes the stops uncomfortably large for USDJPY.
Therefore the attached chart is an hourly, with the trend defined by the channel.