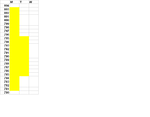
ES Auction Chart
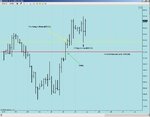
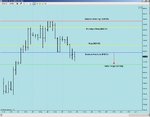
If consolidation occurs over several days, the standard price chart is going to pretty quickly get messy.
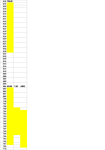
The Auction Chart plots the Daily Balance Areas, with overlapping areas plotted horizontally and non-overlapping trending areas plotted vertically.
Monday and Tuesday are plotted, and it can be seen that Value has contracted on Tuesday and is contained within Monday's Balance Area.
This chart should hopefully give a quick guide to Market Condition and will have more meaning over an extended time period.
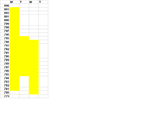
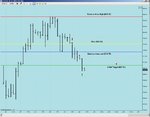
If consolidation occurs over several days, the standard price chart is going to pretty quickly get messy.
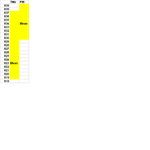
The Auction Chart plots the Daily Balance Areas, with overlapping areas plotted horizontally and non-overlapping trending areas plotted vertically.
Monday and Tuesday are plotted, and it can be seen that Value has contracted on Tuesday and is contained within Monday's Balance Area.
This chart should hopefully give a quick guide to Market Condition and will have more meaning over an extended time period.