Joey's MP Journal

Status
Not open for further replies.
AUDUSD trade setup

As with several of the majors, yesterday saw an indecisive day ahead of today's FOMC interest rate decision.

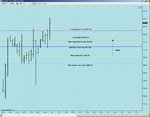
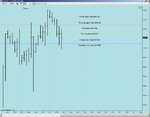
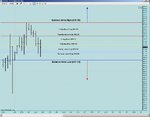
On the Daily, an inside bar has formed, with the preceding outside bar pretty much in line with the next pivot level (confluence of historical support & resistance).

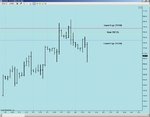
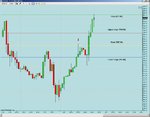
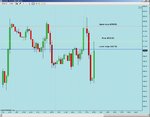
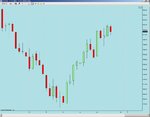
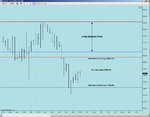
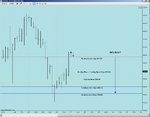
The current H4 chart looks to be providing an excellent "leg up" into the next stage of the uptrend.

Specifically: an inside bar, then a fakeout off the ascending trendline, and headed in the direction of the general trend.

Note: the current bar looks like it may be a pin. This is a bonus, but not necessary - rejection is the key.
 

Attachments

  • audusdd.gif
    audusdd.gif
    11.3 KB · Views: 168
  • audusdh4gif.gif
    audusdh4gif.gif
    9.4 KB · Views: 159
Last edited:
USDJPY (Rolling Spread)

With regard to the setup in post #209:

Pin Retracement-Continuation trade

(13th March) Bought @ 98.57
(18th March) Sold @ 98.04

P/L = -0.53 (-53 pips)
 

Attachments

  • usdjpyexit.gif
    usdjpyexit.gif
    9.7 KB · Views: 165
USDCAD (Rolling Spread)

With regard to the setup in post #208,

Inside Bar Fakeout trade

(13th March) Sold @ 1.2718
(19th March) Bought @ 1.2419

P/L = +0.0299 (+299 pips)

This one bugged me from the start as I felt I had entered about 25 pips too late. However, learnt from the failed EURUSD trade (post #213) and managed the trade much better.

No other positions on at the moment (missed out on AUDUSD again!), but looking for a break of the 95.26 level in USDJPY.
 

Attachments

  • usdcadexit.gif
    usdcadexit.gif
    11.7 KB · Views: 162
  • ticket.jpg
    ticket.jpg
    52 KB · Views: 154
USDJPY trade setup

Half an hour to go until the close of the H4 in USDJPY, but it looks like an inside bar formation with a failed attempt to rally above the 95.66 level.

This level was also the base of the large pin on the Daily chart, and was finally broken in the Overnight Session.

Could lead to a decent move down.
 

Attachments

  • usdjopyh4.gif
    usdjopyh4.gif
    8.6 KB · Views: 166
Half an hour to go until the close of the H4 in USDJPY, but it looks like an inside bar formation with a failed attempt to rally above the 95.66 level.

This level was also the base of the large pin on the Daily chart, and was finally broken in the Overnight Session.

Could lead to a decent move down.

The result for this one:

(19th March) Sold @ 95.22
(20th March) Bought @ 95.68

P/L = -0.46 (-46 pips)
 

Attachments

  • usdjpy.gif
    usdjpy.gif
    7.5 KB · Views: 151
Combination Bars - GBPJPY Weekly

I'm posting this as a reference for an interesting setup which combines price action behaviour around a range using an inside bar, a pin bar as a fakeout bar and then 3 types of entry depending on the trader's individual risk profile.

The four green arrows represent the various stages of the setup.

Arrows 1 and 2

The inside bar forms - the short term trend is up.

The range is marked by the blue and red lines.

Arrow 3

A pin-bar pierces the blue line and closes back within the range.

At this point there are 3 entries:

Arrow 4

Aggressive: Enter at the breakout of the top of the pin bar

Medium: Enter at the close of the pin bar

Conservative: Enter at a 50% retrace of the pin bar.

On the chart, the yellow line shows the conservative entry, which was filled this week.
 

Attachments

  • gbpjpy.gif
    gbpjpy.gif
    8.5 KB · Views: 163
Last edited:
ES Setup for Monday

I'm getting a lot of benefit from posting the setups in this journal. The pressure of posting something in advance, with the risk of looking like a fool, is a lot worse than the actual trade risk for me - and is in a weird sort of way making the trading process less daunting!

With regard to ES, and with the influence of FX starting to show, I am now using 240 minute charts for extra clarity.

For Monday

Unless the market strongly rallies past 782.00 in the last half hour, I will finally have an area I wish to target for a pullback short in the S&P500. It's a big distance to cover, perhaps even unlikely, in which case a new area will become the focus for Tuesday.

Hopefully, the "fat" part of that balance area is pretty clear to the naked eye. In fact, there's nothing more to it than that - a visual pattern where the area should really "stand out". Also, the mean is far more important than the edges, which are fairly arbitrary and can be placed closer to the extremes of the range if desired.
 

Attachments

  • ESforMonday.jpg
    ESforMonday.jpg
    65.7 KB · Views: 146
Last edited:
GBPCHF Daily Setup

I've now decided to include the following crosses in my candidate list:

EURGBP
EURCHF
EURJPY
GBPJPY
GBPCHF
EURAUD

Scanning these each evening along with the following majors should help identify the best price action setups:

USDCHF
GBPUSD
EURUSD
USDJPY
AUDUSD
USDCAD

I'm finding that the approach of filtering first at the Daily chart, and then the H4 chart is delivering the best results.

In accordance with this, my favourite going into next week is GBPCHF.

On the Daily, there has been an inside bar followed by the downside rejection of that inside bar and a close back in within the range. It's a bonus that the rejection bar is also a pin, however it's not essential.

Zooming in to the H4 chart, it can be seen that there is an ascending support line, plus a (just broken) descending resistance line.

The top of the inside bar, is a pivot level on the H4 chart.

Therefore, I am focussing on the breakout of that inside bar / pivot level, using the trendlines for confluence.
 

Attachments

  • gbpchfd.gif
    gbpchfd.gif
    10.3 KB · Views: 146
  • gbpchf.gif
    gbpchf.gif
    11.1 KB · Views: 141
Last edited:
S&P500 (Daily Future)

Maximizing profits versus a smooth equity curve isn't the most easy approach emotionally. Was up 9 handles on this one, but ended up losing 15. Soldier on.

Mean Rotation Trade
Sold @ 786.60
Bought @ 801.80

P/L = -15.20
 

Attachments

  • ESexit.jpg
    ESexit.jpg
    101.7 KB · Views: 167
ES June Setup for Thursday

Nice looking Balance Area to fade for Thursday, with the mean also a good pivot level.

Upper Edge: 818.00
Mean: 812.00
Lower Edge: 808.75

I'm starting to "hope" a lot at the moment, which probably isn't a good sign...
 

Attachments

  • ESSetup.jpg
    ESSetup.jpg
    78 KB · Views: 155
Nice looking Balance Area to fade for Thursday, with the mean also a good pivot level.

Upper Edge: 818.00
Mean: 812.00
Lower Edge: 808.75

I'm starting to "hope" a lot at the moment, which probably isn't a good sign...

I'm afraid a 15.40 points loss on this one.

The good run with the method occurred when the general market trend was down - an effective pullback-continuation method.

I built this particular method during the sustained bear market, which has been pretty fruitful, but I can't continue only trading the short side with it.

Plus, it doesn't work as effectively when entries are just from the mean - the edges play an important role aswell.

Overall, not too disastrous due to some good FTSE positions, but still a work in progress.

Edit: Just a couple of notes to myself re: S&P trading so that I don't forget:

1) Value must be migrating and not coming into balance

2) Only trade in the direction of the trend, where trend is defined by the change in Value
 
Last edited:
Defining Trend Using Market Profile

The next chart is a bit "busy", but is the best I can come up with to try and capture the current condition of the market.

Basically, the minimum for an uptrend is a rising mean and vice-versa for a downtrend.

However, a market in consolidation will contain a minor trend or a slightly rising or falling mean. Unfortunately that is where the discretion comes in!

There's about 45 minutes to go in the current day, but I doubt that Thursday's Balance Area will change much. The market today, although overlapping in terms of Value with Wednesday, has made enough of a shift, in my opinion, to warrant being called an Uptrend.

Indeed, it looks like the market will open the next session above value - a good guide for continuation.
 

Attachments

  • Trend.jpg
    Trend.jpg
    67.4 KB · Views: 157
Last edited:
The balancing process which began Thursday was completed today with a close near Thursday's mean and overlapping Value. Correspondingly, today was an Inside Bar on the Daily.

For the method I'm using for the S&P, I now stay out until the market gives clues to where it is next headed.
 

Attachments

  • ESDaily.jpg
    ESDaily.jpg
    54.5 KB · Views: 167
  • Balance.jpg
    Balance.jpg
    71.4 KB · Views: 148
Balance Breakout Strategy

I've been trying to work out how the product that I've barely got any experience at all in (spot FX) is subsidising failed trades in something I've nearly been doing for a year (the S&P). I think it's to do with initiating trades with short term momentum in FX, whilst being guilty of top & bottom picking in S&P.

I think I've fallen into the trap of using Value Areas, Means etc. as levels to fade, rather than using them across days to indicate Market Condition. By accident more than design the post late last night made me realise this!

As stated earlier, in this situation I think it's best to let the market show it's hand. It's possible that the market may continue to balance, extending the range one way or the other, but the biggest reward lies in a continuaton breakout to the upside or a retracement breakout to the downside.

The Strategy

Dependent on the market opening within the range late Sunday evening:

Trade 1

Entry Buy Stop @ 831.20
Protective Stop @ 823.20

2/3 of position Limit target @ 843.20
1/3 of position run 'til close

Trade 2 (One Cancels Other)

Entry Sell Stop @ 806.80
Protective Buy Stop @ 814.80

2/3 of position Limit target 794.80
1/3 of position run 'til close

The chart is the same as yesterday's but highlighting the Bracket limits.
 

Attachments

  • BreakoutPrep.jpg
    BreakoutPrep.jpg
    101.1 KB · Views: 157
Last edited:
Just one more change to the previous post - the final 1/3 of the position is now being run as far as possible and isn't limited until the close of the day of entry.

The main reason for this final nail in the coffin for daytrading for me is twofold:

(a) I'm psychologically comfortable with holding positions overnight - I've been doing this with my FTSE futures / options strategy since 2001, so I know I'm not kidding myself with this.

(b) That final 1/3 of the position could well be where the bulk of the "surprise" profits lie - I haven't looked at this in great detail, but it would seem to follow that if you're fortunate enough to get in at the beginning of a move, then why would that move be constrained by the end of the day of entry?

I'm looking forward to seeing how it goes :)
 
ES June 09

Yesterday, I got filled on the downside breakout of the 2-day Balance Area.

The first 2/3 of the position was covered for a 12 point profit:

(30th March) Sold 2 units @ 806.80
(30th March) Bought 2 units @ 794.80

P/L = 2 x 12.00 = 24.00 points.

I'm still running with the remaining 1/3.

Yesterday's profile saw non-overlapping Value (trend) vis-a-vis the preceding 2-day Balance Area, and in the overnight session today, price is drifting towards Monday's Mean ahead of the economic data out at 3pm BST.

The first alert to closing the remainder of the position comes when Value starts to overlap, and the market comes into balance again.
 

Attachments

  • BalanceBreakout.jpg
    BalanceBreakout.jpg
    71.1 KB · Views: 141
  • ticket.jpg
    ticket.jpg
    31.4 KB · Views: 148
Last edited:
ES June 09 continued

Today's action has seen a Balance Area contained completely within Monday's, suggesting consolidation, even though at first glance it felt like a strong rally.

Of great interest to me was the failed auction above the "outside" Balance Area. In theory, if price gets outside of Value and is swiftly rejected, then market participants will panic and flock to test the other side. In Mind Over Markets, they reckon the probability of this happening is about 80%, but others reckon it's more like 60%.

The chart shows the two Balance Areas (today's Upper Edge is also confluent with Monday's Mean).

I'll be moving my stop to 810.10 at the end of today - at a safe distance from the range, and I'll see what happens next.
 

Attachments

  • ValueAreaRule.jpg
    ValueAreaRule.jpg
    68.7 KB · Views: 134
Status
Not open for further replies.
Top