Deadline June

What to do with latest strategy with mixed results

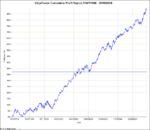
First up, this strategy produced an unoptimised profit of $70K p.a. on a basket of 7 forex pairs.

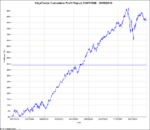
The walk-forward though half-bombed: producing $2500 p.a. on the basket.

So question (1): is half-bombing as bad as full blow-out bomb curve-fit where the walk-forward results just lose the same amount as the optimisation won? i.e. do I chuck it out?

My unprofessional opinion is no, don't chuck it, it wasn't curve fit, it just didn't work in the walk-forward period because that is such a manic period. In fact, was it the whole period 01/07/2008 - present that was loss making, or was it in fact just 2008 and the first half of 2009?

Whatever, doesn't matter, I'll just try optimising this. I'm definitely not going to do anything with this strategy unoptimised, in case the currency markets revert back to their 2008/9 behaviour. That would eat up my little account like Ken Clarke devouring a canape at a Downing St reception.

NB the 2 optimisation parameters might not make much difference. I'll put some pretty equity curves up here later to show what happened.
 
What is your reason for optimising over so many years and then a walk forward over so few?

Seems to me that you are doing that the wrong way around?

I would optimize over a sample of about 5 years. These years might not be consecutive years but I would pick 5 years that showed a very broad range of trading conditions. Once the optimisation has been completed, I would then walk forward using the other 5 years data that you did not use on the optimisation.
 
What is your reason for optimising over so many years and then a walk forward over so few?

Pardo "Design and Optimisation of Trading Systems" was my starting point, he optimised over 2 years and then walked-forward 6 months IIRC.

I just thought, this is one market, this is one history, I want to optimise over as long a history as I can to reduce the curve-fitting, and so I took out 2 years for the walk-forward since I thought 2 years would be a good out-of-sample test period.

I would optimize over a sample of about 5 years. These years might not be consecutive years but I would pick 5 years that showed a very broad range of trading conditions.

Going through the whole 50,000 bars of history to pick out 5 years of differing conditions would take days, wouldn't it? And how do you do it? I once got a dot-matrix printer and printed out the daily bars for the GBPUSD for the last 25 years on continuous paper. You definitely get an overview!So I'd be looking for trending up, trending down and ranging periods?
 
EUR/USD optimisation - walkforward

OK, I give up on the optimisation over 10 years for this strategy. It ain't gonna work for the whole thing and with my PC's CPU speed, 7 pairs of hourly bars at 50,000 bars an instrument, it would take a good 3 hours and if the result is similar to this for the EUR/USD then it's not worth it.

To be fair to the strategy, EUR/USD was the worst performer in the walk-forward using unoptimised parameters, but I'm not staking 40 grand on it.
 

Attachments

  • equity.png
    equity.png
    49.3 KB · Views: 148
  • walkforward.png
    walkforward.png
    50.5 KB · Views: 154
Pardo "Design and Optimisation of Trading Systems" was my starting point, he optimised over 2 years and then walked-forward 6 months IIRC.
I just thought, this is one market, this is one history, I want to optimise over as long a history as I can to reduce the curve-fitting, and so I took out 2 years for the walk-forward since I thought 2 years would be a good out-of-sample test period.

I haven’t heard of Pardo "Design and Optimisation of Trading Systems’’ but I differ in my opinion to yours regarding curve fitting. Even if you successfully fit a set of trading parameters to 10+ years of history if the walk forward testing or out of sample data is too small it’s just pot luck if the results are good or not depending on the conditions of the walk forward testing. The optimisation size is as important as the walk forward size.

Going through the whole 50,000 bars of history to pick out 5 years of differing conditions would take days, wouldn't it? And how do you do it? I once got a dot-matrix printer and printed out the daily bars for the GBPUSD for the last 25 years on continuous paper. You definitely get an overview! So I'd be looking for trending up, trending down and ranging periods?

Regardless of direction a trend is a trend, so that’s one type of condition that needs to be included. High volatility and low volatility are two more conditions. Lastly, chopping or ranging times also need including. So I would say get a mixture of all four conditions, and then optimize on this sample to find a compromise. The walk forward period would also need varied conditions.

R
 
Just slightly correcting myself:
Robert Pardo "Design, Testing and Optimization of Trading Systems"

It's a good book. Well, OK maybe I should reserve judgement for a couple of months and if I'm still liquid, then I'll say it's a good book.

Even if you successfully fit a set of trading parameters to 10+ years of history if the walk forward testing or out of sample data is too small it’s just pot luck if the results are good or not depending on the conditions of the walk forward testing. The optimisation size is as important as the walk forward size.

Very good point. I guess I would definitely have to include some of the 2008-2010 period into my optimisation window and into my walk-forward.

So correct me if I'm wrong, you're saying, to include all these different market conditions into the out-of-sample data, it has to be longer.

But I've only identified this 2008-2010 bad period or 'high volatility' period by chance in that I recognise the symptoms that show up in my backtesting results. What I need to do then is to learn to identify it by eye as I scroll through the history. I guess indicators are going to help here: ATR obviously. Anything else that you use?
 
Very good point. I guess I would definitely have to include some of the 2008-2010 period into my optimisation window and into my walk-forward.

So correct me if I'm wrong, you're saying, to include all these different market conditions into the out-of-sample data, it has to be longer.

Basically the smaller the walk forward the less relevant the results may be, this is because the results may just be a representation of the markets at that time, and not a good representation of the system used to produce them.

What I’m saying is that the walk forward sample must include all different types of conditions, as the back testing must!! If it doesn’t, it’s just as misleading as creating a system optimized only on ranging markets then expecting it to cope with trending markets perfectly. I feel the walk forward must contain a broad range of conditions to even start to prove it’s conclusive.


But I've only identified this 2008-2010 bad period or 'high volatility' period by chance in that I recognise the symptoms that show up in my back testing results. What I need to do then is to learn to identify it by eye as I scroll through the history. I guess indicators are going to help here: ATR obviously. Anything else that you use?

I don’t use ATR, and I’m not entirely sure what you’re asking here??

R
 
What I need to do then is to learn to identify it by eye as I scroll through the history. I guess indicators are going to help here: ATR obviously. Anything else that you use?

I don’t use ATR, and I’m not entirely sure what you’re asking here??

R

OK, let me rephrase the question. What is the quickest way to get an overview and categorise any particular market history you look at?

I think I can identify a trend up - that would be something starting down on the bottom left and ending up in the top right. Vice versa for trend down. The period though - what sort of period am I looking for... at least 6 months? Guess it depends on the timescale: I'm using hourly bars.

High volatility - I guess I'd stick an ATR line on the bottom of the chart and fix the y-axis scale for the complete history. if it's up the top, it's highly volatile. Low volatility the other way around.

Ranging or choppy markets - not sure how I'd identify them. Perhaps just the default state when they're not trending? Doesn't sound so robust though.
 
Just splashed out on a new computer since I figured it's going to be too much for my old PC if I'm running strategies on it and trying to do long backtests.

Got an Intel dual core 3GHz CPU, 4Gb RAM + 1TB hard drive, plus it's highly energy efficient - apparently the electricity savings more than make up for its price premium over a 2 year life considering it's going to be running 24x5, likely 24x7 actually.

Ideally I might end up using this new one as my strategy development box, if I can move my live trading software onto a server where I don't have to worry about my crappy broadband connection. And possibly get better fills because of the faster connection.

But in the meantime I'll be running the live trading - whoops getting ahead of myself now - the simulated trading on this new one.
 
Back to strategy development after messing around all day.

After reaching a dead-end with my strategies using the 10 year optimisation window and the 2 year walk-forward period, it seems I have 3 options:

(1) soldier on with the same optimisation / walk-forward process on new strategies which I'd have to invent

(2) adopt a shorter optimisation window with a longer walk-forward window, which both incorporate periods with all 4 fundamental market data types - trending, ranging, high volatility, low volatility. This process would require a lot more clicking and hitting 'go' in NinjaTrader

Actually, Rossini - what software are you using?

(3) Use the walk-forward functionality in NinjaTrader. This steps through the history, optimising and then walking forward on periods whose lengths you configure, and it collates all the results into a big combined result of walk-forwards at the end. This is a simple point-and-click operation that I can run overnight.

On the face of it, option (3) is the lowest hanging fruit.

There are many questions though. NinjaTrader sets default values for the optimisation and walk-forward windows both to 28 days. With my strategy-in-the-works now a 28 day period generates about 100 trades which I reckon is significant enough, although I've learnt to be sceptical about the significance of anything in system development and trading. So I can't accept that this would work. My instinct tells me this isn't right, surely this cannot be.

One way to find out. I'll run the process on the EURUSD now and then set it running in simulated trading with the optimisation from the last 28 days. The results of the simulated trading should fall within the max and min for the stats from the walk-forwards that NinjaTrader churns out.
 
Last edited:
hey mate

Just read through the journal, very interesting stuff. Just got into the whole automated side of things myself and there is a lot of useful information that i have taken out of it. Hope everything is going well and good luck
 
Deadline June - got to kick into overdrive to get there

wow, someone reading my journal! I figured I was probably the only one reading it anymore. glad it actually made sense to you. any and all comments appreciated.

these last 3 days have seen me panicking because the NinjaTrader strategy I'm playing with now is nicely profitable - all the up until 2008 and then it flatlines.

I'm trying loads of different things, but I'm slowly reaching the inescapable conclusion that it's just dead in the water and I'm going to abandon it, and see what else I can find.

The basics are, enter on pullbacks from the trend about 1 ATR in the other direction from the close, and put a parabolic stop in place to exit. A couple of other little rules make it perform better but I think I've taken it as far as I can.

From looking over the worst performing periods and markets, it looks like the fast and slow MA lines do not make a good filter for the trend, or it's the pullbacks with limit order entries I should ditch and go for break-outs with stops.
 
Hey,

I'm using TradeStation now, but until very recently I was using ProRealTime and MT4. I have done all my back testing manually. Have you tried looking on the daily TF, maybe less noise than the 1hr? Also are you running the system 24/5? If so what are the results like if you where to only run it on London/US sessions?
 
I started out on daily bars and did a lot of research, found a lot of stuff but it all needs such big account sizes.

I was using futures data and the minimum lot was too big for me - it might sound lame but it was the extended drawdowns which I wasn't prepared to take a gamble on. I guess with forex I could reduce the leverage so yes, I should put that on the list of things to look at.

What I think offers great potential is using two time frames, although as I'm writing this I'm getting pretty hacked off with all the negative results from the ideas I'm getting today. Maybe that's why I'm on the forum at the moment :jester:

And yes I am using 24x5. Using sessions is not something I'd thought about. Do you mean close all your trades at the end of the session? Using hourly bars, my stops just trail so there's no concept of sessions or weekends even. Maybe foolish, although my trade size is not so big that it would kill my account to take a massive hit over the weekend. Did you find it useful?
 
For swing trading I use daily bars, I just find there to be much less noise. I was just suggesting if your using hourly bars then maybe only open new positions when there is volume/movement in the market. Closing a position according to your rules would be mandatory regardless of the time of day.
 
2008-present flatlining.

Here's the really clever strategy I wrote that won't make any money in the last 2 years that you use it.

Did this with ninjatrader's walk-forward optimizer using 28 day optimization windows and 28 day walk-forward periods. So this is about 250 sequential walk-forward periods cobbled together (hence the little steps).
 

Attachments

  • MyHTML1.gif
    MyHTML1.gif
    13.7 KB · Views: 300
out of interest, what would happen if you optimise using 08/09 and then use 1998-2007 as walk forward?
 
haha well i wondered what that would be like myself, but until now i didn't bother testing it. Figured it was a bit too late to try trading 1997 live. :jester:

but here is the result: 2007 - 2010 optimization: Net profit $58000, drawdown $4000, roughly 3 years.

1998 - 2007 walk-forward: net $56000, drawdown $6000*. 9 years. So approximately 30% of the optimised performance.

Compared to the other way around, the process seems to work nicely - well, 30% of the optimised performance isn't too bad, although I know some who'd turn their noses up at it.

So what were you thinking? would you use something like that?


* NB NinjaTrader has some rough edges to it - one of which I just remembered. That is not the total drawdown across the basket of 8 forex pairs, that is the average max drawdown. I've already asked NinjaTrader why they do that and they think that the average is the more important statistic. The total max drawdown across the basket could be more or less, who knows, I'd have to export huge amounts of data from NinjaTrader into excel to find out.
 
Last edited:
Top