JumpOff
1
- Messages
- 702
- Likes
- 14
Hi,
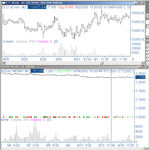
I'm learning about custom studies in sierra chart. Fun! But the documentation seems weak. They have a study called island reversal that is displayed as a "point" in the study settings. It looks like the top graph in this attachment. See that pink dot in the middle of theprice bars?
So I wrote this test study, and when I choose "point" as the type of display, using the same settings as island reversal, it squishes the price bars so that they become unreadable (lower chart).
Have any of you created a custom study that puts a point near the price bars, or does a paintbar thing like tradestation?
Thanks,
JO


