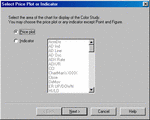
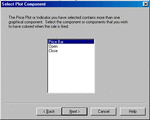
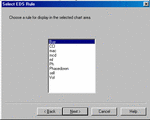
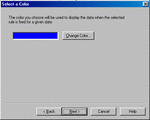
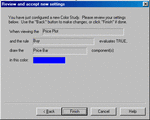
Here is a description of how to get the new colour studies working in the new AIQ TEP 6.0. The idea is that a price bar is highlighted on a particular EDS condition, ususlly "buy if..". Then when you look at a historical chart, all occurances of buy is true, will be readily seen by virtue of the fact that the price bar will be in a "highlighted" colour....
This is in 6 parts......
First from "Charts" select chart/settings/colour studies.
In the box below EDS File, select the EDS routine that you want to use.
Then click " create new colour study"
After viewing the gif, press "back" on your browser.
This is in 6 parts......
First from "Charts" select chart/settings/colour studies.
In the box below EDS File, select the EDS routine that you want to use.
Then click " create new colour study"
After viewing the gif, press "back" on your browser.


