Jedster2001
Active member
- Messages
- 120
- Likes
- 3
Its really interesting to have your viewpoint and to see things from your point of view, so many thanks for the continuing commentary.
I have been looking a bit further at the idea of isolating the strength of a particular currency, and how I might go about trading it. Some of the simple crosses are really good signals, and some are not so good. Rarely however, is a signal completely wrong. That is a good sign I feel 🙂
I was trying to think of a way that would help verify the cross/signal. The first obvious way for me, is to consider looking at multiple timeframes. That is, for example if there is inherent weakness in a currency in the longer term, then I would be more inclined to go short (on a shorter timeframe). Or, if I went long, I would be very careful, and certainly my target would be less than the target when trading short.
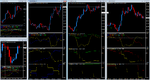
Attached is a screen shot I setup for the Yen. It is setup vs EUR, USD and GBP. The three main 15M pair charts have the strengthmeter showing just those pairs, but also below it I added a 1H and 4H version of the indicator. The arrows on the chart are highlighting where a cross has taken place on the 15M indicator.
The point of this would be to look at the longer term strength/weakness and use that to determine when (if at all) to take the signal and what sort of stop/target to set.
As I talk about this I obviously have the benefit of hindsight here, but clearly on the EURJPY chart we can see that when the signal came on the 15M chart, the 1H indicator is also moving in the same direction and preparing for a cross (the 1H cross came a little after the 15M cross). Equally we look at the 4H chart and we can see that the EUR is strengthening and the Yen is weakening and again later on we also had a cross there. So at the time, it should have been a pretty good trade. Note I did actually trade this signal, although I got in a little late as I was doing the school run, it still got me close on 1% profit 😀
The same sort of thing is happening on the USDJPY chart, although here we can clearly see that the USD isn't moving too much and the volatility is coming almost entirely from the Yen. The 4H indicator at the bottom is a great help here, we can see the USD strength is rising slowly (and has been for a while), so if/when the JPY weakens, it would be a good trade. Sure enough, it was a good move to trade.
The GBPJPY chart is pretty interesting I think as it has two potential signals. The 1H indicator shows us that initially this morning it was the Yen weakening significantly more than the GBP, however this afternoon the situation reversed and the GBP weakened considerably and the Yen started to stabilise a little.
Just my thoughts as I explore how I can use this...
J
I have been looking a bit further at the idea of isolating the strength of a particular currency, and how I might go about trading it. Some of the simple crosses are really good signals, and some are not so good. Rarely however, is a signal completely wrong. That is a good sign I feel 🙂
I was trying to think of a way that would help verify the cross/signal. The first obvious way for me, is to consider looking at multiple timeframes. That is, for example if there is inherent weakness in a currency in the longer term, then I would be more inclined to go short (on a shorter timeframe). Or, if I went long, I would be very careful, and certainly my target would be less than the target when trading short.
Attached is a screen shot I setup for the Yen. It is setup vs EUR, USD and GBP. The three main 15M pair charts have the strengthmeter showing just those pairs, but also below it I added a 1H and 4H version of the indicator. The arrows on the chart are highlighting where a cross has taken place on the 15M indicator.
The point of this would be to look at the longer term strength/weakness and use that to determine when (if at all) to take the signal and what sort of stop/target to set.
As I talk about this I obviously have the benefit of hindsight here, but clearly on the EURJPY chart we can see that when the signal came on the 15M chart, the 1H indicator is also moving in the same direction and preparing for a cross (the 1H cross came a little after the 15M cross). Equally we look at the 4H chart and we can see that the EUR is strengthening and the Yen is weakening and again later on we also had a cross there. So at the time, it should have been a pretty good trade. Note I did actually trade this signal, although I got in a little late as I was doing the school run, it still got me close on 1% profit 😀
The same sort of thing is happening on the USDJPY chart, although here we can clearly see that the USD isn't moving too much and the volatility is coming almost entirely from the Yen. The 4H indicator at the bottom is a great help here, we can see the USD strength is rising slowly (and has been for a while), so if/when the JPY weakens, it would be a good trade. Sure enough, it was a good move to trade.
The GBPJPY chart is pretty interesting I think as it has two potential signals. The 1H indicator shows us that initially this morning it was the Yen weakening significantly more than the GBP, however this afternoon the situation reversed and the GBP weakened considerably and the Yen started to stabilise a little.
Just my thoughts as I explore how I can use this...
J
hmmm....
Dow won and kept going ..........YEN and USD submitted to that pressure and fell ......Euro stepped in for more pips .....interesting !
Can you all see how this way of looking at the markets is more satisfying than shouting at a pairchart ?
N