You are using an out of date browser. It may not display this or other websites correctly.
You should upgrade or use an alternative browser.
You should upgrade or use an alternative browser.
Clear Recomendation For EUR/USD (Elliot Analysis)
- Thread starter patricio_w
- Start date
- Watchers 8
patricio_w
Member
- Messages
- 86
- Likes
- 1
patricio_w said:There is a new low formed at 1.1913, for those who are following the trade. I personally move my stop to that target, one pip above at 1.1912, in case the market touch that stop there is a nice 26 pips
Still waiting for more rally up, before we can see the WC
My kindest Regards
We were close to that 1.1970, just a few pips, but for those who was following this trade 26 excelent wining pips, with a very small capital expousure.
Hope next time to catch all the rally, excelent work!!!
Kindest Regards
patricio_w
Member
- Messages
- 86
- Likes
- 1
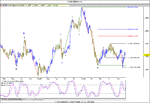
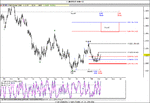
60M Chart
The decline from March 7th is clear an impulsive way, ao after that Wave 1, the only case iam seeing is than that rally should be a Wave A:2. After that rally we can see a new rally up finishing in 1.1951, that should be a Wave B, (the case is that is not like a Wave B, or at least it doent seams to be so).
Anyway, i said than on Friday, the correction should be complete, but is it complete?
To start thinking so we must see first a breaking of 1.1929 (Fridays high), to say than WC:2 is in place at 1.1859, after that a break of 1.1951 should follow.
My refcomendation foe intrady on Monday is to the Long side, waiting fo the oscialtor on the over sold zone. Monday is important for the intraday analysis, to see if the correction is over or not
1440 M Chart
Not to much to add at the last week analysis, if the W2 is ni place, and the confirmation of it comes, then is an excelent opportunity for a middle-long term trade to the Long Side
10080m Chart
The cross over on the Dtosc to the blue and pink lines is signaling than a multiweek low is finishing, if it is not already finished. The possible targets for the Wave C is marked between red lines
Conclusion
For middle-long term trade, the same analysis, waiting for the oscilator the Long Side is my recomendation, waiting for the targets i marked
For intraday trades, 1.1929, and 1.1953, are key points to confirm the correction Wave 2 is finished, the a rally up should follow for a Wave 3
Attachments
patricio_w
Member
- Messages
- 86
- Likes
- 1
As i said hours ago, a break of 1.1929 and then 1.1951, was happened, ones who could catch the way up congratulations
With this move Wc:2 should be in place, or near completition, now a 0.500 to 0.618 fibo retracements correction of the rally up is expected
Lets see what happens.
KIndest Regards
With this move Wc:2 should be in place, or near completition, now a 0.500 to 0.618 fibo retracements correction of the rally up is expected
Lets see what happens.
KIndest Regards
patricio_w
Member
- Messages
- 86
- Likes
- 1
patricio_w said:As i said hours ago, a break of 1.1929 and then 1.1951, was happened, ones who could catch the way up congratulations
With this move Wc:2 should be in place, or near completition, now a 0.500 to 0.618 fibo retracements correction of the rally up is expected
Lets see what happens.
KIndest Regards
Last retracement was above 0.500, is that it?, My Dtosc shows a possiblity on there, ill take it buying at current price 1.1935, stop at 1.1916, kindest regrdas
patricio_w
Member
- Messages
- 86
- Likes
- 1
patricio_w said:Last retracement was above 0.500, is that it?, My Dtosc shows a possiblity on there, ill take it buying at current price 1.1935, stop at 1.1916, kindest regrdas
There is a new low, just into the breakeven zone, so i moved my stop there.
The ones who are more carefoul cn take winings now, with 30 pips.
Iam lookng forward to break 1.1968 and catch all the rally up
Lets wait and see
patricio_w
Member
- Messages
- 86
- Likes
- 1
patricio_w said:There is a new low, just into the breakeven zone, so i moved my stop there.
The ones who are more carefoul cn take winings now, with 30 pips.
Iam lookng forward to break 1.1968 and catch all the rally up
Lets wait and see
For those who are following this trade, and still on it, see that ther is a big fight to brake the 1.1968, so lets see than there is a small low on the priors candle at 1.1961, lets keep an eye on there, still remains the breakeven position
patricio_w
Member
- Messages
- 86
- Likes
- 1
patricio_w said:For those who are following this trade, and still on it, see that ther is a big fight to brake the 1.1968, so lets see than there is a small low on the priors candle at 1.1961, lets keep an eye on there, still remains the breakeven position
i ve moved my stop, one pip above the new low, 1.1955, thats +18 pips incase of a drop down
The brake of 1.1968 is a signaling than W3 should be on moving
Kindest Regards
patricio_w
Member
- Messages
- 86
- Likes
- 1
patricio_w said:i ve moved my stop, one pip above the new low, 1.1955, thats +18 pips incase of a drop down
The brake of 1.1968 is a signaling than W3 should be on moving
Kindest Regards
I leaved the trade on 1,1981, the Dtosc iis in OB Zone, the ones who want to stay 1.2002 is a big resitance, 44 pips, nice!!!1
patricio_w
Member
- Messages
- 86
- Likes
- 1
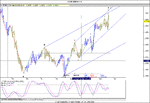
On dayli an weekley chart, is the same analysis, as usual i keep the same view as the last couples of month. Traders who went LONG for middle-long term trades, are wining now several pips
About intraday, we have to keep an eye on two important points, the first is 1.2048, that is the maximun possible target for the W5:1 of 3. but i think than W5:1 of 3 is already in place at 100% Alternate Price Projection of the W1:1: of 3. marked as 1.2025 (high was 1.2030 to be accurated)
If thats the case, then a correction to 1.1944 is expected, so for those who want to go Short, be carefoul and take a deep look at the Oscilator, and wait fot trend reversal, 1.2048 seams to be a good stop.
Next point is 1.2092, take a look of the daily chart, after that point is brake, a quickly move to 1.2321 is expected
I personally will wait for the correction, to be in place, or wait for the final move of these W1 of 3, and then go LONG after the correction, for the W3:3 of 3. I prefer to run with the trend always
Kindest Regards
Attachments
patricio_w
Member
- Messages
- 86
- Likes
- 1
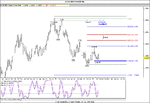
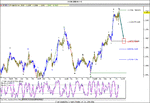
Is 1.2061 the end of W3:1 of 3?, well looking at the Oscilator we are seeing than the CrossOver is showing a trend reversal, interrupted by another crossover to the upside bout not into the Over Sold Zone, what is clear is than this W3:1 of 3 is near completition, if it is not already complete. First key point is 1.2092 March 6 high. then 1.2002 tha is the 1.618 Alternate Place Projection of w1:1 of 3. If we do the same with the Time Projection shows us than the W3:1 of 3 should be ending today, as 1.1618 ATP of the W1
Regards
Regards
Attachments
patricio_w
Member
- Messages
- 86
- Likes
- 1
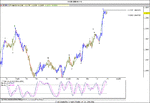
Ending the week with a huge really to the upside as i anticipated. My analysis is still intact, the possible target for this W5:1 of 3 is 1.2216 till 1.2250 tops.
It should be ending today, or tomorrow. All time frames, inlcuding Monthly are in Over Bought Zone, signalign a multi day to the upside finishing, if it is not already finished.
To the middle-long term trade, as usual as 3 month ago, still to the long side, now for intraday trades, iam looking forward to go short, once the W5 touch it max target, i probly fail a couple of times, but i antipated a correction of the rally up.
Well, while iam writing the analysis aim selling EC at the current price 1.2174, with SL at 1.2188, one pip from the top
Kindest Regards
Attachments
patricio_w
Member
- Messages
- 86
- Likes
- 1
patricio_w said:Ending the week with a huge really to the upside as i anticipated. My analysis is still intact, the possible target for this W5:1 of 3 is 1.2216 till 1.2250 tops.
It should be ending today, or tomorrow. All time frames, inlcuding Monthly are in Over Bought Zone, signalign a multi day to the upside finishing, if it is not already finished.
To the middle-long term trade, as usual as 3 month ago, still to the long side, now for intraday trades, iam looking forward to go short, once the W5 touch it max target, i probly fail a couple of times, but i antipated a correction of the rally up.
Well, while iam writing the analysis aim selling EC at the current price 1.2174, with SL at 1.2188, one pip from the top
Kindest Regards
I sell EC again at 1.2175, SL at 1.2200
patricio_w
Member
- Messages
- 86
- Likes
- 1
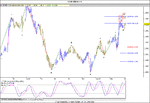
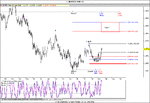
We are reaching the maximun possible targets for a Wave 5, 0.786 % is 1.2220, ann 100% Alternate Price Projection is 1.2245, going further that point i should change the analysis.
In my opinion Wave 5:1 of 3 is near completition if it is not already complete. If that the case, traders should be orientated to the Short Side. After that rally should come the correction, and when we now that?, after breaking 1.2140 that is the low of the W4:5:1 of 3.
After that, shoul come 1.2052, that it is the typicall correction for this Waves, 0.500 fibo retracements.
There is nothing i can say about Time Projection yet, i think than the Ec will move side ways in a very small range, making new lows day by day. No there is a crossover lines in the Oscilator, but not in Over Bought Zone yet
On the dayli chart, i updated the feed, keeping the same chart as 3 months ago. You can see on dayli chart my Price and Time Targets.
Conclusion
Long-Middle term trades should be orientated to the Long Side
Short term trade, should be orientated to the Short side, always following the Oscilator on Over Sold Zone, an taking care than this Wave 5 could still move to higher levels 1.2220 or even 1.2245. In my opinion, Wave 5 should be complete at 1.2206. Seeing the Oscialtor the range between 1.2175 and 1.2190 could be a good enter zone with SL on 1.2207/10, small capital expousure
Kindest Regards
Attachments
patricio_w
Member
- Messages
- 86
- Likes
- 1
There is not much to say today, i keep the same vision as yesterday, the EC made new lows as i expected, but did not take out the 1.2140 yet, so the possibility of an increase is limited by 1.2220, but i still see the short term into the Selling Side. Looking at the Oscilator, the Short Trades are good, once the 1.2140 is taking out, 1.2050 should follow, i think than this correction will last at least all week
Kindest regards
Kindest regards
patricio_w
Member
- Messages
- 86
- Likes
- 1
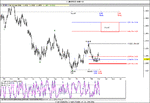
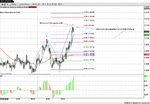
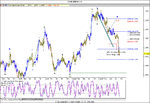
Just to follow EW analysis i made this in 60 minute chart.
We should be into the correction of the last rally up ending 17March.
This first move it seams to be a Wave a:2 of 3. If that the case, we can think of a subdivision of 1.2.3.4.5 waves, typically subdivision of a Wave A.
This subdivision is very nice, W1 is impulsive, and W2 is corrective, and look, the rebound is just on the 0.786% of the W1, nice!!.
Now take a look at the W3, is clearly longer in price and time of W1, adn rather impulsive than corrective. Now theory says than when W2 corrects the 0.786%, W4 (that is the other corrective wave) corrects between 0.382 and 0.500, nice again!!!.
Now i made the projection on where the Wave 5 could go. If the 1.2152 is the high of Wave 4, then making the Wave 1 Alternate Price Projection 1.000 and 1.272, and Wave1-3 Alternate Price Projection 0.236 and 0.382, and retracements of W4 1.272 and 1.618, it showas the typicall possible targets of the Wave 5.
All of this is possible of course, if we are in the correct count. The unic bad thing to say about this count, is than while iam writing this the W4 made a correction till 1.2164, and overlaps into the range of W1. Is not a breaking analysis rule, but i always prefer it doesnt happen
See chart, regards
Attachments
patricio_w
Member
- Messages
- 86
- Likes
- 1
--------------------------------------------------------------------------------
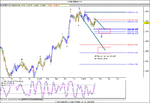
The bearish count its no so important right now, what it is important is than all targets and ideas of all this analysis are correct by now.
The EC made new lows all the past days as i expected, and also reach the targets. I think than this correction, as i said on Friday will last all week, 100% Alternate Price Projecttion of the rally up its just 24 March, Friday.
I am looking forward for more correction to the bearish side, we did not reach the 0.500% yet, so this 2 days remaining should show us more downside.
If it is not, then we are probably at a different kind of complex correction, or the trend up will be much stronger, so the correction will not reach more than this
I personally think than EC is going to correct at least 0.500%, so at very Short-Term trade i suggest to sell, always following the Oscilator, then we have to wait for a trend reversal, and go long, for a very few days
Kindest Regards
Attachments
patricio_w
Member
- Messages
- 86
- Likes
- 1
Thanks Carlos.
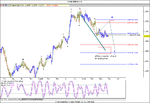
Correction broke my targets and its looking for 1.1933 (0.786 fibo retracement). Tomorrow its the day than this Correction should be finishing, so, i will be very alert of the possible trend reversal to the long side. The lines are on the Over Sold Zone, but not overlaping themselves yet
Kindest Regards
Attachments
Patricio,
What is your opinion about the retracement of wave 4 into the range of wave 1. Strict Elliott rules say wave 4 cannot go below, in the current up move, the top of wave 1, but we have now exceeded this by quite some way in the current pattern.
Do you subscribe to this rule or are you in the 'should not' camp rather than the 'must not'?
Thanks,
G-Man