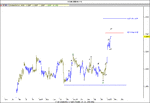
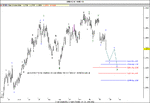
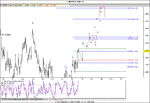
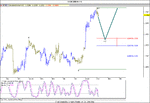
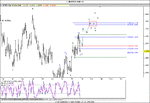
Clear Recomendation For EUR/USD (Elliot Analysis)

patricio_w

Member
Messages
86
Likes
1
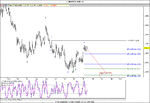
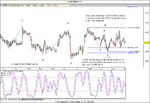
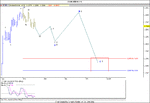
Touching January 12 at 1.2163 confirms that W2 is finished
If this is a W3, the possible first target is marked on the picture.
Following the oscilator, the crosovers on the OverSold zone is and excelent oportunity for Long positions
1.2659 is the MAximun target for a w3of 3, (162% of the December 30th Alternate Price Projection
Para mismo analisis en español en richdad.com.ar
 

Attachments

  • eur17012006.gif
    eur17012006.gif
    75.4 KB · Views: 564
Yes my friend, iam building the Daily Analysis and then i will show you a bearish scenario count, assuming the the W5 failure of the 2Dec low was not really a W5.
Give some time i will very please to post it.
Kindest regards to you
 
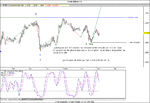
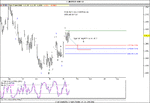
Here is the Daily look of the prior picture, this is 1440M EUR/USD on the bullish count.
The Stochastic Oscilator made already crossover on the OS zone, should keep the bullish count for the next day on 8.....(is the best look at this moment)
Also take notice than the 60m data made a crossover on the 21..... just in the 1.2050, tha was a nice stop loss for long trades, here then the 2 pictures
para analisis en español por favor richdad.com.ar
 

Attachments

  • eurodaily.gif
    eurodaily.gif
    90.7 KB · Views: 459
patricio_w said:
Here is the Daily look of the prior picture, this is 1440M EUR/USD on the bullish count.
The Stochastic Oscilator made already crossover on the OS zone, should keep the bullish count for the next day on 8.....(is the best look at this moment)
Also take notice than the 60m data made a crossover on the 21..... just in the 1.2050, tha was a nice stop loss for long trades, here then the 2 pictures
para analisis en español por favor richdad.com.ar


60m picture data
 

Attachments

  • eur17012006.gif
    eur17012006.gif
    77 KB · Views: 381
Joules MM1 said:
Could you give us an "alternative count" for this chart please ?

Cheers. Julian

Julian
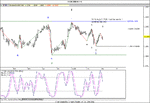
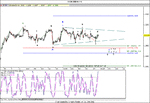
An alternative bearish count on the picture below.
On this count the 2dec failure low is not really a w5.
One of the first warning is than W4 overlaps into the W1, but is not a breaking rule, but
if 1.2269 (extreme w2) is taking, these analysis is out
Hope you this is what you ask me.
Kindest Regards
 

Attachments

  • eurodailybearish.gif
    eurodailybearish.gif
    81.6 KB · Views: 377
Nice posts patricio, I focus on the euro but rarely look beyond an hourly chart, good to read though, cheers.

Fx.
 
Joules MM1 said:
Could you give us an "alternative count" for this chart please ?

Cheers. Julian

and update of the prior chart shows the Oscilator on the Over Bought Zone at 1.2118, see the chart upload.
One of the posibilities y to take out (or already done) the possible entry, or at least into breakeven.
I still see a bullish count of the trend, and a new entry pint will be following the Stochastic on the 21.........
Analisis en español en richdad.com.ar
 

Attachments

  • eur17012006.gif
    eur17012006.gif
    79.7 KB · Views: 359
Last update of the bullish count of the day, see u tomorrow
Para español richdad.com.ar
 

Attachments

  • eur17012006ultimo.gif
    eur17012006ultimo.gif
    78.2 KB · Views: 406
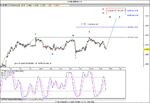
Yesterday we were saying that only a break of 1.2139 (high WB) should be confirming than W2 is in place.
So far, its seams so.
Now only a break of 1.2048/50 will brake this analysis, into an ABDCE complex correction, instead of the bullish count i prefer to think
Here i post the update chart, keeping my bullish scenario for the hold week, traing to reach the target for a typical Wave 3
Following stochastic oscilator on the over sold zone with the crossover lines should be goog for long trades-

Para este mismo analisis en español en richdad.com.ar
 

Attachments

  • eur18012006.gif
    eur18012006.gif
    74.1 KB · Views: 359
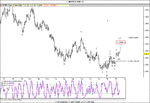
We need now to break 1.2174 high of 16Jan, that breaking sould be signaling that W2:3 is complete or near completition.

1.2042 is the typical correction for a W2:3, thats is the 0.786 of w1

Breaking that point into the downside will signal that W2 is not really a w2, will signal than is probably a complex correction ABCDE

The oscilator is not in OB Zone, with the crossover lines in that zone, will be again a nice opportunity for long trades

See the chart bellow


Para analisis en español en richdad.com.ar
 

Attachments

  • 180106medainochje.gif
    180106medainochje.gif
    95.3 KB · Views: 355
Eventhough the`prior analysis is not already out, this scenario doesnt seam to be apropieated for a W3 yet. The 60 minute data do not show us much, even the 1.2048 is intact, the time and price for a W3 is faraway

Lets concentrate for now in the daily data.

Today is was a trend reversal on the oscilator on the over bought zone, the rally from 30dece to jan6, shows clearly a w1, and the correction of a w1:3 is a typical 0.500 to 0.618 of w1:3, it means then than w2:3 do not finish yet, and the idea of W2 looking for its target is a much clear scenario.

Then my analysis now is for the downside looking for a target between 1.1977 and 1.1933, before the W3:3 starts.

Watching the oscilator then, positions short with the cross over on the oversold zone

Then 1.2130 must be take out to start thinking thna W2:3 to be complete o near completition


Analisis en castellano en richdad.com.ar
 

Attachments

  • eurodaily19.gif
    eurodaily19.gif
    72 KB · Views: 341
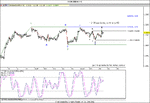
On the 60m data i make another posible scenario to the downside.
This bearish look is on the idea than the W2 is not in place, lookin at the complex correction we are seeing actually. This complex corretion of and ABDCE after an ABC correction, it has its target between 1.1996 and 1.1930. The typical correction of a W2 in this case is between 0.500 and 0.618 of the W1, that is 1.1977 and 1.1930, also a WC typical target is the Alternate Price Pojection of the WA and the retracements of the WB, that is on the chart 1.1996 and 1.1947.
Lokking at the trend reversal yesterday on the oscilator the chances are in favor at first on the downside, lokking for the bottom of the W2
If th triangule drow on the chart is broke on the upside reaching the 1.2174 (WBhigh) or even reaching 1.2178 (W1high) that will signal than W2 should be complete or near completition, and this anylisis is out

Para este mismo analisis en español richdad.com.ar
 

Attachments

  • euro20.gif
    euro20.gif
    85.9 KB · Views: 291
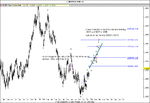
With the rally of Friday continuing today the W2 should be complete or near completition. Iam quoting the first chart of the first post to show where are the posiible target of this Wave 3:3.

Also iam attaching a Daily Chart showing where this corrective rally should be ending and when.

This should be a corrective rally of the 1,2,3,4,5 waves started on 30dic of 2004 ended 17 nov of 2005

It should be ending on 10/04/2006, in the last W5, the daily chart is very clear about my idea, tomorrow i will post a complete 1hour chart

Mismo analiis en castellano en richdad.com.ar
 

Attachments

  • eurdayli.gif
    eurdayli.gif
    83.5 KB · Views: 313
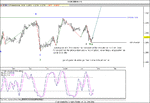
60m data chart update.
POsible subdivition of and w3:3, vewry impulsive rally, posible target betwenn 1.2312/91
Mismo analisis en español en richdad.com.ar
 

Attachments

  • eurhour.gif
    eurhour.gif
    56.4 KB · Views: 332
As we know the USD/CHF moves in the opposite direction fo the pair we are analising EUR/USD.
As long we study the pair and we catch the correct trend, also we can take a good look of the USD/CHF, i do myself this all the time, so why dont i share my opinion with you all
Here is an update of the 1440m data of USD/CHF an a possible scenario to the downtrend. Typical 1orA and 2orB is clearly now a WAVES 1,2,3,4,5 rally. The W3 is developing now looking for its targets.

The W3:3 typical target its the 2.618 Alternate Price Projection fo the W1:3 and the retracements 1.618 of W2:3 (1.2332) we have to be alert of that point, or near that for a corrective rally ABC of the W4:3, once the corrective rally starts we probably going to see a correction of 0.382 to 0.500 of the W3:3, that point should the and excelent oportunity to cach all the Wave 5:3 to the possible targets at 1.2201 to 1.2087

Thanks to the opportunity to share my charts with you

Para analisis en castellano ver richdad.com.ar
 

Attachments

  • chf1440.gif
    chf1440.gif
    64.8 KB · Views: 320
Euro is doing a manual movement for now, hope stay like this. I made two chart, dayli and hour chart, just to express my view.

On the last post i charted target between 1.2312 and 1.2396 max, well lest take the idea than 1.2320 was the end of the Wave3:3, just to start thinking a posible scenario to the upside on W5, just to earn some money.

On the Dayli chart (the same i posted today) we can see where the Wave 2 (corrective rally) should end

On the hour chart (if, if, if the W3:3 is in place) it will come a correction Wave 4 ending bwetween the ratio 0.500 and 0.618 of Wave 3:3.

That point is between 1.2180 and 1.2147, and the corrective rally on the dayli chart is between 1.2163 and 1.2126


If this analysis is correct, we have to be alert of an ABC correction, and looking at the Oscilator, we can catch the W5:3, waiting for the crossover on the Over Sold Zone


Para este mismo analisis en castellano ver richdad.com.ar
 

Attachments

  • eurodayli.gif
    eurodayli.gif
    80.8 KB · Views: 265
  • eurohour.gif
    eurohour.gif
    76.4 KB · Views: 214
Here is a possible scenario on the 1H EUR/USD

Time and price came alll from the analysis

Kindest regards to all
 

Attachments

  • eurohour.gif
    eurohour.gif
    58.1 KB · Views: 239
I think this is going to be a very lateral correction, as it did on W2, complex correction of an ABCDE, instead of an ABC, the rally we can see by now is a typically WA we can divided into minor waves 1,2,3,4,5.
The key to take care, i mean, the key that is going to show us when this w4:3 is complete or near to be complete is the ratios information, we have to marke very carefouly 3 points, 0.382, 0.5000 and 0.618 of the Wave 3:3, and to be more specific ill take a deep look between 0.500 and 0.618, an if you want to to try a price i ll say 1.2163, why?
First the W2:3 had corrected the 0.786, typically correction for a W2:3, in that cases, most of the time, W4:3, dont take 0.786, if the W2:3 did it before, and why 1.2163?, because is the same correction the euro is doing into the 1440m chart. the ideal correction of the wave2 is 0500 of the W1, that is 1.2163.
About time? well, the lateral moveof the Wave 2:3 took like a week to develop, we could see probably all this week the Euro, moving sideways between 1.2320 and 1.2160.
A break of 1.2320, without reaching at least 1.2213 (0382 retracements of W3:3) is strongly bullish

I will take a vacation till Sunday, i will try to make some coments, but it will be no charts till next Monday, have a great traders sessions to all of you, take care, thanks
 
--------------------------------------------------------------------------------

Well, everything went so quick, it seams than W4 is complete, with the last low at 1.2250 (far from the 1.2163 i said), an the new high 1.2323 (13 pips uper the 24jan high), is W5 complete??, or should be complete?, at first view it seams so, i missed the opportunity to take it in.
If, if, if W%:3 is in place, if it is coplete at the new high of 1.2323we shall see a correction of the Hold W3 at 0.500 or 0.618 ratios, that is traduced between 1.2164 and 1.2126, thats the price analysis, about the time projection of this correction, it should be terminated between 30jan and 1 of february, if not, we have to rebuilt the analysis
About trading, well following the Oscilator on Over Bought zone, go short its a nice opportunity.
Not respecting the time projection or breaking the 1.2323 are the two possiblities of re biulding the analysis.

Sorry for not posting charts, iam on vacation till Sunday

Kindest regards to all
 
My friends, here iam again on the arena. Nice 5 days vacation.

Lets start saying than the Euro is still doing an excelent movement, something than all books about Elliot Wave wants, a nice scenario with perfects Waves


If you remember my last, we were saying than a correction must finish about 1 of Feb max, an i draw a chart with a typical correction on 0.500 and 0.618 that was 1.2126, well if you see the same chart now, this correction rebouted into 0.786 fibonacci ratio, not typical ratio for this correction, but still an important one


If this is it shoud be finished in 1.2072, so time and price were correct, and we will see now a rally up. But we have to take care of something, if the Dec low till 24Jan high, if all of that rally is a W1 we could see then a correction till 1.1990 to 1.1913, thats why all of this analysis is not so clear


For those who wants to take the risk, 1.2072 is a nice stop loss to go long, waiting fo the oscilator on the crossover reversal bullish


Today i will post the hour chart a a nwe weekly chart, be patience.


Nice to be back
 

Attachments

  • eurovac.gif
    eurovac.gif
    84.3 KB · Views: 240
Top