Clear Recomendation For EUR/USD (Elliot Analysis)

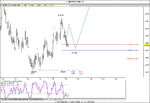
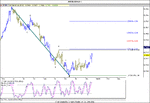
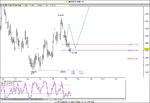
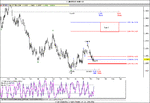
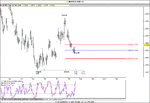
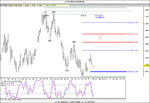
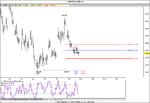
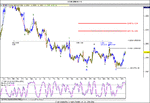
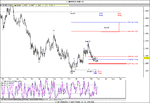
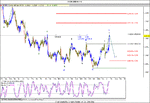
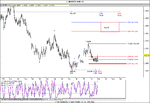
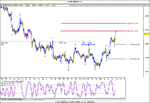
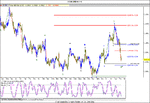
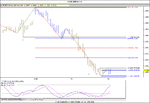
There is no clearly defined count after the 25jan. Tha pair is still making new lows, so if its nothing clear, lets not invent it.
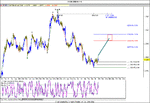
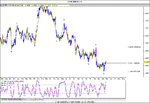
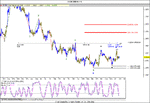
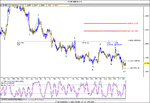
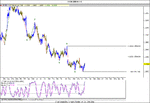
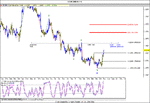
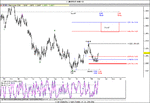
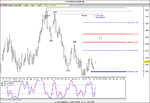
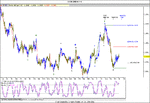
All i can say right now, is than the 1.1912 is the maximun correcttion for a Wave 2 or B, and my opinion is to be orientated to the Long side, looking and following the Oscilator on thje Over Sold Zone


My kindest regards to all


Mismo analisis en castellano ver richdad.com.ar
 
The Wave count Wav1 or A that should be completed at 25jan is not claerly defined by now, however the 0.618 fibi retracemets of that rally 1.1912 remains untouch, so thats why i keep my bullish scenario and i cuggestd to trade on the long side.

Todays high breaking the the prior minor swing high at 1.1986 show us than this correction should be complete or near completition.


Time projection remains intact, middle of February is still the projection of this Wave 2 or B


Kindest Regards to all of you


Mismo analisis en castellano ver el foro en richdad.com.ar
 

Attachments

  • eur1440.gif
    eur1440.gif
    72.3 KB · Views: 249
breaking the 1.1986 like i said yesterday, the Wave A should be complete at 1.1923 (without breaking the 1.1912 i anunced) or near completition.Howerver this was (if it was) a very long Wave A, so the analysis is still alive, iam keeping my bullish vision, as i been saying.

The middle of February as a Price Proyection for this Wave B is still alive also, i think this Wave B should last between 14th and 17 of February.

So my recomendation is on the Long side, waiting for the opportunity on the crossover lines

Time Projection for Wave B: 14 to 17 Feb
Price Projection for Wave B: 1.2122 / 1.2269

For short-term long trades 1.1964 / 1.1945 / 1.1923 are very nice stops

Here s the 1h chart

Mismo analisis en español en richdad.com.ar
 

Attachments

  • eur60.gif
    eur60.gif
    101.9 KB · Views: 228
This is something i want to share about the Aud/USD
I ve been following the pair, the drop down from 23jan, was a typically 1.2.3.4.5, ending at 0.618, just into it.
Now is doing a side ways correction looking for 1.7448, breaking that should be confirming the Wave 5, so the correction eventually will climb to 0.618 fibo external retracement, also i think there is a nice chance to trade to the long side, each time we aproach to 1.7366

Kindest regards to all
 

Attachments

  • aud60.gif
    aud60.gif
    75.7 KB · Views: 230
A new low was made, just a few pips over the 1.618 External Retracemenst, typical for a w5:5. If this is correct, W5 should be in place, then a Brake of 1.1917 should be bullish, confirming the W5 is in place, next step 1.2024, also the Oscilator is bullish


1.1857 Typical External Retyracemnets ofr a w5 of 5

1.2024 W 4 low, a brake of that confirms the W5


Take a look also at the original dayli chart published at January, a brake also of 1.2024, should be confirming Wave 2 or B, remember also we are reaching the Time Price Projection made before, middle of February, is 1.1861 the end of it?


Kindest Regards
 

Attachments

  • eur60.gif
    eur60.gif
    93.9 KB · Views: 265
  • eur1440.gif
    eur1440.gif
    73.1 KB · Views: 240
the Ec is still making new lows form Jan 25., however the important thing here is not the count, the important thing is then the Rally from Jan 25 is impulsive signaling the multiday low should be ending, either is a Wave 2 or B.

The inmidaiate downside should be limited by 1.1787, thats is the %78.6 of the retracements of the Wave 1 or A. So maybe we are going to reach that level before this downside is complete.


A rally above the 1.1952, should showing us than this downside is finished. then 1.2024 should be confirming this.


I still prefer to swing trades to the long side, following the oscilator on the OS zone, waiting for trend reversal and divergence on the lines.


Kindest Regards to all


Para todo tipo de analisis en español ver richdad.com.ar
 

Attachments

  • eur60.gif
    eur60.gif
    79.8 KB · Views: 219
  • eur1440.gif
    eur1440.gif
    86.3 KB · Views: 234
10080 minute data
Typical price target for this correction between red lines, the same chart i being posting last month.
Time projection is 7 of April
The idea of Nov low is a W5 remains solid. For that the typically corective rally is about the 50% retrac, and should be not complete until 7 of April
If Jan27 hogh is a Wave 1 or A, the trend reversal on the oscilator on the Over Sold Zone should be coincidence with the W2 or B low, and ideally should be completed on 1.1784
See chart belove please

1440 minute data
After Nov low i can see clear a five waves pattern, is that the case Jan high should be a Wave 1 or A, as a being posting, of the corrective rally. The decline of Jan high is rather impulsive than corrective, so this is Wa:2 or is a Wave B, most likely for me. If that the case, this correction should be not complete until middle of march, if the Wave A is complete at 1.1784 of course
See chart below

60 minute data
At the same time i was doing tis analysis, the 1.1955 was taking out as i posted last week, so Wave 1 or A should be confirmed, now looking for 1.2024, and then finishing on the idel price targets at 1.2091 1.2145.

This Wave 2 or B should be finishing by the end of Feb

See chrt below

Conclusion
Traders should be orientated for the long side, floowing the oscilator on 21.... for 60minutes, and 8..... for daily and weekly, trend reversal on the Over Sold Zone are good fro olong positions
Have my kindest regards

Para los de habla hispana como yo visiten richdad.com.ar
 

Attachments

  • 60meur.gif
    60meur.gif
    91.8 KB · Views: 245
  • 1440meur.gif
    1440meur.gif
    73 KB · Views: 205
  • 10080meur.gif
    10080meur.gif
    81.3 KB · Views: 200
With the rally yesterday above 1.1930, signals than Wb:B of 2 or B should be complete, and the Wc:B of 2 or B should be ending around 1.1990 (typical price target), by tomorrow, if its not already complete

Now after today, or maybe tomorrow, a decline bellow Feb 22 wil, signal than WB:2 or B is complete, an then a rally below the Feb16 should follow


Oscilator on all time frame are bearish, in my opinion traders should be orientated to the short trades


Kindest Regards
 

Attachments

  • eur60.gif
    eur60.gif
    91.4 KB · Views: 210
patricio_w said:
With the rally yesterday above 1.1930, signals than Wb:B of 2 or B should be complete, and the Wc:B of 2 or B should be ending around 1.1990 (typical price target), by tomorrow, if its not already complete

Now after today, or maybe tomorrow, a decline bellow Feb 22 wil, signal than WB:2 or B is complete, an then a rally below the Feb16 should follow


Oscilator on all time frame are bearish, in my opinion traders should be orientated to the short trades


Kindest Regards

The EC broke the two points we mencioned, now we need to know if 1.1825 was the w5:C of 2 or B, or was the W3:C of 2 or B. In my opinion i think we shall see a more bearish count, that will coincide with the 0.786 on the dayli chart, around 1.1787, but this is just an opinion.

Traders must be alert to the trend reversal on the Oscialtors, this Wave 2 of B is finishing in price and time targets, if is not already finished


Again, in my opinion the orientation is still on the short side, we still have some days on the south, before we can see the reversal.


Kindest Regards
 

Attachments

  • eur60.gif
    eur60.gif
    91 KB · Views: 203
  • eur1440.gif
    eur1440.gif
    74 KB · Views: 201
With the trend reversal today on the OS Zone, its the signal than Feb 27 low at 1.1825 it was the end of WC:2 or B, However only a rally above pf 1.1971, Feb 23 Wb high is needed to confirm this analysis.

Also 1440 m and 10080 min chart are both in OS ZONE, signaling the rally up.

In my opinion it s possible to think than W2 or B is in place at 1.1825 i n price, also in time, see the dayli chart i posted 2 month ago, the time and price projection are near to complete if they are not already complete


If this is the case, a brake of 1.1971 is a signal to be orientated to the LONG positions, first resistance are 1.2073-1.2132


Kindest Regards
 

Attachments

  • eur60.gif
    eur60.gif
    92.5 KB · Views: 245
  • eur1440.gif
    eur1440.gif
    88.2 KB · Views: 233
Interesting analysis, Patricio.

I would at this stage agree that a break of the 1.1975 high of 20/2 would change the current pattern I would add that the next Delta turning point is not due yet and I would expect a drop to 1.1775 between the 10-17/3. That would complete the current wave count.

A significant break and close above 1.1975 would be required for me to change my position.

G-Man
 
patricio_w said:
With the trend reversal today on the OS Zone, its the signal than Feb 27 low at 1.1825 it was the end of WC:2 or B, However only a rally above pf 1.1971, Feb 23 Wb high is needed to confirm this analysis.

Also 1440 m and 10080 min chart are both in OS ZONE, signaling the rally up.

In my opinion it s possible to think than W2 or B is in place at 1.1825 i n price, also in time, see the dayli chart i posted 2 month ago, the time and price projection are near to complete if they are not already complete


If this is the case, a brake of 1.1971 is a signal to be orientated to the LONG positions, first resistance are 1.2073-1.2132


Kindest Regards

Well, the analysis it seams to be on the correct trend. Not casual the rebound on 1.2023, 1.2024 is the confirmation of the Correction, and the confrimation of Wc:B or 2
If that the case, then we keep the 1440m data chart we started posting in Jan, looking for Targets and Time Projection we did, (see chart)
On the 60m chart data i posted, i draw just and idea of the possible 1.2.3.4.5 (WAVE 1), ended on 1.2023, if that the case, a possible Wave 2 will correct at least the 0.500 fibo.
Next targets are marked in black, final target by the end of March.
The trend reversal are possible to run on the short side, but my opinion is to trade on th LONG side all March

Kindest Regards
 

Attachments

  • eur60.gif
    eur60.gif
    94.7 KB · Views: 245
  • eur1440.gif
    eur1440.gif
    89 KB · Views: 226
Looks like todays strong action has changed my outlook and it would appear that the MTD low was on the 27th.

Would be looking for a retracement down to the next ITD in the next few days after the current high can be confirmed. After that longs are in play for a month or so.

G-Man
 
10080m Data
The oscilator trend reversal shows than W2 or B should be complete, if last week was a B low, then WC price target is around 1.2652 and 1.2891, and time target for complete correction is between 25 march and 7 of April
See the cahrt bellw, is the same we been publishing since Jan1, we keep the same vision

1440 m Data
If Feb27 low was the end of W 2 of B low, then 1.2304 (W a or 1 high) should be braken soon, the inmidiate resistance are 1.2073-1.2132
See chart below, same vision

60 m Data
It seams than the W5 was not complete as we supoused, but is near completition, if is not already complete, typical Target for the W5 are 1.2085 to 1.2095. A decline below Fridays W4:5 its a signal than W5 is near completition, then a decline to 1.1890 should follw to complete the W5 confirmastion

Conclution and Recomendation

For middle-long term trades (till middle of April to be acurated) traders should be orientated to the LONG side
For short term trades, following the next trend reversal on the 60 minute data time frame, traders should be orientated to the SHORT side, for at least a week of so, of correction and confirmation of the rally up

Its my pleasure
 

Attachments

  • 60mdata.gif
    60mdata.gif
    93.2 KB · Views: 229
  • 1440mdata.gif
    1440mdata.gif
    90 KB · Views: 238
  • 10080mdata.gif
    10080mdata.gif
    82.1 KB · Views: 225
Already broke 1.1994, signaling than w5:5 of 1 should be in place and near completition if it is not already complete.
If this is the case, as we have been projected, 1.1890 should follow, the trend reversal we anunced for short term trades to the Short Side was made in 1.2050. 1.1882 is the 0.786 fibo retracement of W1 also
This correction of the rally up should be finishing by the end of this week, so, be alert again now on the trend reversal to the LONG side.
If the analysis is correct, W3 sshould be strong for a rally up for several days

Kindest Regards
 

Attachments

  • eur60.gif
    eur60.gif
    100.9 KB · Views: 207
Looks like there is a fight going on to break the 1.1880 support.

If that goes 1.1855 seems the next likely target, 0.886 retracement of the move up from 1.1827.

Looking at the current price action my money is on the move down ATM.

G-Man
 
Still hold my analysis i been posting for the last two months. I personally enter on a LONG trade, just on the next candle after the cross over lines on the DTOSC. Always i try to enter on trades of about 20 pips sotp loss, i put my stop one pip above the last low. So in conclusion iam waiting to catch the trend reversal for the next rally W3 up, Long at 1.1886, stop at 1.1866

See the chart below, kindest rtegards
 

Attachments

  • trade.gif
    trade.gif
    63 KB · Views: 218
If any of you is following this trade, i ll keep it as i enter. The Dtosc is now on the Over Bought zone, making a cross over lines.


Option 1: a new low could be at 1.1896, so the stop could be now that, if enter was 1.1886, in case the market will tocuh the stop the result is +10


Option 2 : move stop to breakeven


Option 3: keep the stop in 1.1866 an hold


Kindest Regards
 
i think than Wave 2 is not already complete, this rally down is more impulsive than corrective, so i marked this as Wave A:2.

Also time projection is too soon to say than correction is complete, so tomorrow we need to see the Wave B:2 ending, at price projection shown on the chart, about 1.1980 and 1.2006

For those who are following the trade, i personally moved my stop to 1.1896, i think that is a new low, and of course are +10 pips exit.

Tomorrow i will look for at least 1.1970 target, and then exit on that point, looking for trend reversal on Over Bought Zone and then go SHORT.

If the analysis is correct there is a good chance to do both ways

Kindest Regards
 

Attachments

  • trade.gif
    trade.gif
    100.7 KB · Views: 184
There is a new low formed at 1.1913, for those who are following the trade. I personally move my stop to that target, one pip above at 1.1912, in case the market touch that stop there is a nice 26 pips

Still waiting for more rally up, before we can see the WC

My kindest Regards
 
Top