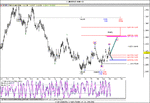
Clear Recomendation For EUR/USD (Elliot Analysis)

G-Man said:
Patricio,

What is your opinion about the retracement of wave 4 into the range of wave 1. Strict Elliott rules say wave 4 cannot go below, in the current up move, the top of wave 1, but we have now exceeded this by quite some way in the current pattern.

Do you subscribe to this rule or are you in the 'should not' camp rather than the 'must not'?

Thanks,

G-Man

Gman,
This is not the case of overlaping range W4 into W1, because are different subdivision, theory says than W4 should not enter into range of W1 of the same range, i mean on the same division. W4 of small range can enter on range of W1 of bigger range.
But, lets supouse than this is the case of overlaping Waves, where says than W4, or W1 or whatever??. Elliot Wave Analysis has nothing to be with Forex or Rules. All of this theiorys and cases of WC,d,e,X adn that "rules" we are mencioning are depending of the analist. You will fine thousands of many differents interpretation about EW Theory. EW mencioned 5 Waves and 3 Waves patron, all that came after are interpretations. Me??, i personally think that if W4 enters into W1 range of the same range, i ll take a deep better look, because maybe my analysis is wrong, but i will not "kill" a hold good analysis just for that. The same happens with Wave s B flat, and Wave 2 than cross the extreme of Wave 1, and Wave 5 s than runs much longer of the possible targets. In EW analysis evcerything, i mean everything is possible, u have to insert your knowledge and theory to understand the trend of the market, then if it is Wave 1 or % or C it doesnt matter, for me its important to understand the correct trend, to follow the direction of the market
Of course its only my point of view, i read others, an of course iam open mined to learn every day
Kindest Regards
 
Thanks, i use this space to post my trade, Long at 1.1964, SL at 1.1952, 1 pips above the low, using the trend possible reversal trend
 
patricio_w said:
Thanks, i use this space to post my trade, Long at 1.1964, SL at 1.1952, 1 pips above the low, using the trend possible reversal trend

Wow!! That is a very tight stop? How often do these types of setup work?
 
FXSCALPER2 said:
Wow!! That is a very tight stop? How often do these types of setup work?

I trade always the trend reversal with a very small capital expousure, sometimes i need of course more than one entry to catch the trend, regards
 
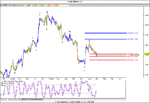
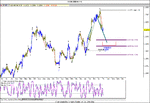
The weekly and dayli chart show us the oscilator on the over sold zone, that s the key that shows than a multi-day low has finished or it is near to.

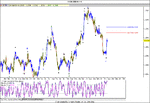
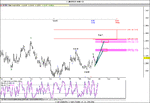
In my opinion 1.1951 should be the ending of Wave 2 of 3, if that the case, the inmidiate upside should be taking resistance at 0.500 and 0.618 of the rally down, see the 60 minute chart.

Now, oscialtor in the 60 m chart is on the Over Bought Zone, so waiting to be in Over Sold Zone it would be an opportunity to the Long Side.

If this is the case, an this analysis is correct, we will see a W3 of 3, the most impulsive of waves.

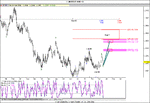
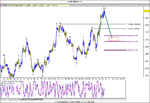
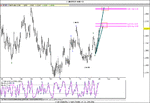
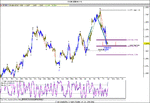
On the daylu chart you have 3 pairs of targets, one is in red, and its the possible target of this Wave 3 ive been posting 3,5 months ago, the other two pairs in pink are the possible targets of the W3:3

In all time frames traders should be orientated to the main trend to the Long side, i think we will see for several days to the upside

Ones who still on the trade i posted its an opportunity to take profits now, and wait for the next trend reversal

See charts below

REgards
 

Attachments

  • 60eur.gif
    60eur.gif
    106.8 KB · Views: 197
  • 1440eur.gif
    1440eur.gif
    94 KB · Views: 198
  • 10080eur.gif
    10080eur.gif
    77.6 KB · Views: 172
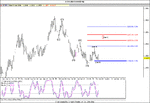
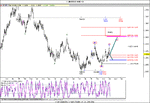
W1:1:3 of 3 should be in place at 27march high, if that the case, then W2:1:3 of 3 should be finishing, if it is not already finished at 1.1999, just between 0.500 and 0.618 fibo retracements.

If this is the case, then trend reversal on the oscilator on over sold zone should be signaling a new possible trade to the long side, W3:1 of 3 should be testing at least the resistance targets market in blue, remember those targets are the 0.500 and 0.618 fibo external retracements of the W2 of 3.


Always adjust you re stop lost as mucha as you can, minimal capital expousure traing to catch the trend reversal


Regards
 

Attachments

  • 60eur.gif
    60eur.gif
    79.3 KB · Views: 183
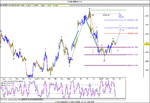
Wave count isnt clear enought as i wish, but its not the case to force a wave count. Our analysis is still intact, reaching the price and time targets as we draw (see 60 and 1440 m data)

After the 24 march low (Wave2) the count is not so clear, minor Wave 1 is not looks like a Wave 1 and also Wave 4 is overlaping into Wave 1 range


What it is important is to see in the short term (next week as much) to see the Ec breaking 1.2175 and then 1.2206


On the other hand dayli and weekly chart are in the Over Bought ZOne, signaling than this multi day to the upside is near to finish, if its not finished yet


So until the count show itself more crystal, i rather stay aside and take a deep better look.


Conclusion


Short-Term: not clear

Middle-Long Term: not clear
 

Attachments

  • 60eur.gif
    60eur.gif
    79.3 KB · Views: 174
  • 1440eur.gif
    1440eur.gif
    81.3 KB · Views: 183
It has happened again. EC has breaken the 2 point we draw yesterday, and should be finishing this trend up into Wave 5, if its not already finished.

But if you take a deep look into the 1440 minute data, i placed serveral days ago to pairs of posible targets in pink, the first one is the possiblity range for this trend up to be finishing, and also if you take a look at the Oscilator you will notice than is on OS Zone, signaling than this multi day to the upside is finishing.

At this momnet EC 1.2301, with possiblities to make a trend reversal on 1.2332/64 range. If that the case, then Traders should be orientated to the short side for several days, a correction to this rally up is inevitable.
In 60 m data i keep the markes i draw yesterday just to see, and in differents colours we can see the possible targest of this correction

Short-Term trade: SHort side, waiting for the oscilator on OS Zone, 60m data is not in place right now

Middle-Long Term Trade: Long Side, with reserves (1.1825 were and excelent entry point as i marked in Feb, now the price and time targets are tight for thinking in a Long term trade to the Long side)

REgards
 

Attachments

  • 60eur.gif
    60eur.gif
    107.7 KB · Views: 197
  • 1440eur.gif
    1440eur.gif
    94.7 KB · Views: 185
patricio_w said:
It has happened again. EC has breaken the 2 point we draw yesterday, and should be finishing this trend up into Wave 5, if its not already finished.

But if you take a deep look into the 1440 minute data, i placed serveral days ago to pairs of posible targets in pink, the first one is the possiblity range for this trend up to be finishing, and also if you take a look at the Oscilator you will notice than is on OS Zone, signaling than this multi day to the upside is finishing.

At this momnet EC 1.2301, with possiblities to make a trend reversal on 1.2332/64 range. If that the case, then Traders should be orientated to the short side for several days, a correction to this rally up is inevitable.
In 60 m data i keep the markes i draw yesterday just to see, and in differents colours we can see the possible targest of this correction

Short-Term trade: SHort side, waiting for the oscilator on OS Zone, 60m data is not in place right now

Middle-Long Term Trade: Long Side, with reserves (1.1825 were and excelent entry point as i marked in Feb, now the price and time targets are tight for thinking in a Long term trade to the Long side)

REgards

Wave 5 should be in place at 1.2331 (1.2332/64 zone i posted yerterday) one pip behind my bands.

If this is the case, and Wave 5 has already finished, then we must expect the correction i said yerterday

60m data chart made the trens reversal in the OB Zone, and 1440 minute data it s near to happen the same. Short side trades are good to set

My kindest regards
 
patricio_w said:
Wave 5 should be in place at 1.2331 (1.2332/64 zone i posted yerterday) one pip behind my bands.

If this is the case, and Wave 5 has already finished, then we must expect the correction i said yerterday

60m data chart made the trens reversal in the OB Zone, and 1440 minute data it s near to happen the same. Short side trades are good to set

My kindest regards

It seams it was the high, for those who take that trend reversal on 1.2331 now are severals pips ahead.

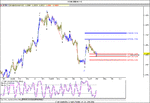
Time and price projections are in the picture, i keep the 1.2127 to 1.2085 range for price (0.500 and 0.618 fibo retracements) and between 7 and 10th of april for time projection

Those who Sold on 1.2331 i suggest to take profits now, and wait for the next trend reversal on Over Bought Zone, of course the trend is still to the down-side, need to test at least the 0.500 fibo retracement

Regards to all of you
 

Attachments

  • 60eur.gif
    60eur.gif
    95.3 KB · Views: 194
There is to different posiblities on my view now. The first vision sqays to me than the WC of the Corrective rally has finished on 1.2331m making a perfect ABC correction where Wc finished just a few pips over the WA. If that the case, then correction to the down side should be continuing without taking out WB low.

Other vision says than 1.2331 was a W1:3 of 3, if that the case then 1.2090 should be the completition or ner completition of W2:3 of 3, then the typical targets for this W2:3 of 3 could be also 1.2078, 1.2018 and even 1.1933


In my opinion i think than more downside is expected by the market, i rather stay aside in this cases, but if a have to make a recomendation i should be trading to the Short Side following the oscilator for at least the next week or so


See on my 60 m chart that i keep the draws i made on thrusday, the markets was following that draws, but iam not sure about the upside yet.


On 1440m data i draw the numbers over my chart published on January, showin the 2 possiblities right now, one is an ABC correction with a square in red, the other vision is 1,2,3,4,5 waves. On the middle-long term both visions are bullish of course, but in the short to middle term is not so clear


Please tell me if iam not clear with the explanations, regards
 

Attachments

  • 60mdata.gif
    60mdata.gif
    98.1 KB · Views: 207
  • 1440mdata.gif
    1440mdata.gif
    101.8 KB · Views: 212
The five wave pattern that had begun on 6april it seams to be finished 10april.

If that the case, then a corrective rally to the upside should be coming, 0.500, 0.618 and 0.786 are the typical targets for that correction, than should be ending no far from this week.

So, for the short-term trade, following the oscilator the trend should be up for at least this week, i drawed a probable scenario on the chart


Middle-Long term trade remains un clear for me, regards
 
patricio_w said:
The five wave pattern that had begun on 6april it seams to be finished 10april.

If that the case, then a corrective rally to the upside should be coming, 0.500, 0.618 and 0.786 are the typical targets for that correction, than should be ending no far from this week.

So, for the short-term trade, following the oscilator the trend should be up for at least this week, i drawed a probable scenario on the chart


Middle-Long term trade remains un clear for me, regards

Charts
 

Attachments

  • 60eur.gif
    60eur.gif
    98 KB · Views: 231
  • 1440eur.gif
    1440eur.gif
    102.5 KB · Views: 232
The corrective rally up to the downside started on April 6th is reaching its target. I keep all the draws made on the last chart, and i add some ABC waves. At this moment its not so important the wave count, what it is important to see the trend. In my opinion, the multiday to the low has finished, an on the short term (this week or so) we should see the EC moving up.
My recomendation is to keep trading LONG, as i pointed in the last post. Note than 3 points are resistance as 1.2203, 1.2223, 1.2233, breaking those points we could see then see a 0.786 fibo correction, looking to test 1.2276.
About middle-long term trade see the dayli chart, it remains unclear for me yet
Regards to all
 
patricio_w said:
The corrective rally up to the downside started on April 6th is reaching its target. I keep all the draws made on the last chart, and i add some ABC waves. At this moment its not so important the wave count, what it is important to see the trend. In my opinion, the multiday to the low has finished, an on the short term (this week or so) we should see the EC moving up.
My recomendation is to keep trading LONG, as i pointed in the last post. Note than 3 points are resistance as 1.2203, 1.2223, 1.2233, breaking those points we could see then see a 0.786 fibo correction, looking to test 1.2276.
About middle-long term trade see the dayli chart, it remains unclear for me yet
Regards to all

It seams my anlysis is inthe correct trend, took the 3 points today, broke the 1.2276 for a few pips, now made a correction.
I am buying now at 1.2250 with SL at 1.2240
 
hi,
reading your analysis for quite some time . enjoying it. may be in future I will trade
currencies . Now adays I am trading only stocks .
Regards to you
 
newtrader22 said:
hi,
reading your analysis for quite some time . enjoying it. may be in future I will trade
currencies . Now adays I am trading only stocks .
Regards to you

Great, thanks. Do you know where can i get free data feed for stocks, i use MT4 for Currencies, is there something like that for stocks?
Regards
 
patricio_w said:
Great, thanks. Do you know where can i get free data feed for stocks, i use MT4 for Currencies, is there something like that for stocks?
Regards

Hola Patricio,
I use the premium services from Pro Realtime . com. Their charting is superb (significantly better than Yahoo, sorry newtrader). The EoD data is free but the charting is the same as the premium package. There is just about everything you need.

Un Saludo,
Dave
 
Top