pedro01
Guest
- Messages
- 1,058
- Likes
- 150
I'll make a start at evaluating them - if I need help I'll let you know.
Ronan
Great - I think you & Naeem should team up as he's been looking too !
I'll make a start at evaluating them - if I need help I'll let you know.
Ronan
Great - I think you & Naeem should team up as he's been looking too !
Will do - I'm going to need some help!! I plan to start at the week-end once I've completed the set-up on my PC
rj,
The code has been verified but I keep getting the following message: “ Floating point numerical overload”.
Naeem
rj,
What are you looking to test? I have a few indicators that I've been watching but I've had data problems so I think I’m going to be dropping IB as a data source and go with IQ feed. If you need some help with the Ehler indicators let me know.
I've got very basic coding experience but I am trying hard to code up the Fisher RVI in a similar way to A_B's brilliant Macci MTF indicator. Most of the Ehler indicators work differently to the Macci so bear that in mind.
If you’re looking to test something may I suggest you take a look at the Inverse Fisher Cyber Cycle. I’ll post the code but I have to tell you I can’t get it to work on my system for some reason. The code has been verified but I keep getting the following message: “ Floating point numerical overload”. This is indicator works in a similar way to the Macci so it will be easier to test from the start.
Naeem
Hi Naeem
The code you posted works fine for me on all the stock charts I tried but I do get the error you refer to when applied to the INDU chart. Maybe, along the lines of what DC posted, its because the absolute value of INDU is so much higher than a typical stock???
Cheers
Steve
ANTAEAN OSCILLATORS
This collection of oscillators are those that either mark the market turning points with surgical precision or have exceptionally low lag. With these oscillators there is no longer a need to wait for confirming signals. The oscillators come as ELS code for plug-in to your TradeStation. Each oscillator is described in an accompanying information file. The EasyLanguage code is open and not protected. The oscillators in this collection are:
Sinewave
Cyber Cycle
Stochastic RSI
Fisher Transform
Inverse Fisher Transform
CG Oscillator
HERCULEAN SMOOTHERS
The indicators in this collection are adaptive to market volatility or are nonlinear filters used to smooth the data. If your trading encounters whipsaw trades, these nonlinear filters may be your answer. These filters move rapidly when the market moves rapidly, but remain steady and smooth in sideways markets. The filters come as ELS code for plug-in to your TradeStation. Each filter is described in an accompanying information file. The EasyLanguage code is open and not protected. The smoothers in this collection are:
KAMA (Kaufman Adaptive Moving Average)
VIDYA (Variable Index Dynamic Average)
MAMA (MESA Adaptive Moving Average)
EHLERS Filter
Median Filter
MA-Median Difference Tuned Moving Average
Nonlinear Laguerre
I’ll post the code but I have to tell you I can’t get it to work on my system for some reason. The code has been verified but I keep getting the following message: “ Floating point numerical overload”. This indicator works in a similar way to the Macci so it will be easier to test from the start.
Naeem
Inputs: Price((H+L)/2),
		alpha(.07);

Vars: 	Smooth(0),
		Cycle(0),
		ICycle(0);

Smooth = (Price + 2*Price[1] + 2*Price[2] + Price[3])/6;
Cycle = (1 - .5*alpha)*(1 - .5*alpha)*(Smooth - 2*Smooth[1] + Smooth[2]) + 2*(1 -
alpha)*Cycle[1] - (1 - alpha)*(1 - alpha)*Cycle[2];
If currentbar < 7 then Cycle = (Price - 2*Price[1] + Price[2]) / 4;


If AbsValue(Cycle) > 100 Then ICycle = ICycle[1]
	Else ICycle = (ExpValue(2*Cycle) - 1) / (ExpValue(2*Cycle) + 1);


Plot1(ICycle, "Cycle");
Plot2(0.5, "Sell Ref");
Plot3(-0.5, "Buy Ref");Hi Naeem
The code you posted works fine for me on all the stock charts I tried but I do get the error you refer to when applied to the INDU chart. Maybe, along the lines of what DC posted, its because the absolute value of INDU is so much higher than a typical stock???
Cheers
Steve
I'd be looking at the oscillators & the filters.
Do we really have the code for all of this ? Or just the oscillators ?
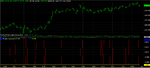
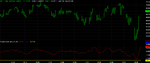
It runs in my system (see attached), but is that how the INDU chart should look ?A_B,
Cheers for your help there mate. Problem is still there though. I'm still getting the "Floating point numercal" message.
Steve,
I think you're spot on with that. Could you or anyone test out A_B's new code. The problem might not be the code but my set up or something.
Pete,
We only need the oscillators. The oscillators advertised on Mesa have not been treated with the extra filters. The codes me and lwebb have posted are based on his latest work as far as I'm aware.
Cheers
Naeem.
A_B,
Cheers for your help there mate. Problem is still there though. I'm still getting the "Floating point numercal" message.
Inputs: Price((H+L)/2),
		alpha(.07);

Vars: 	Smooth(0),
		Cycle(0),
		ICycle(0);

Smooth = (Price + 2*Price[1] + 2*Price[2] + Price[3])/6;
Cycle = (1 - .5*alpha)*(1 - .5*alpha)*(Smooth - 2*Smooth[1] + Smooth[2]) + 2*(1 -
alpha)*Cycle[1] - (1 - alpha)*(1 - alpha)*Cycle[2];
If currentbar < 7 then Cycle = (Price - 2*Price[1] + Price[2]) / 4;


If AbsValue(Cycle) > 10 Then ICycle = ICycle[1]
	Else ICycle = (ExpValue(2*Cycle) - 1) / (ExpValue(2*Cycle) + 1);


Plot1(ICycle, "Cycle");
Plot2(0.5, "Sell Ref");
Plot3(-0.5, "Buy Ref");Inputs: Price((H+L)/20),
alpha(.07);Pete,
We only need the oscillators. The oscillators advertised on Mesa have not been treated with the extra filters. The codes me and lwebb have posted are based on his latest work as far as I'm aware.
Cheers
Naeem.
It runs in my system (see attached), but is that how the INDU chart should look ?
Charlton
Naeem
In the last seminar, Iraj mentioned one of the problems with the cycles is that they weren't adaptive to volatility - so in different market conditions they don't adjust.
That was why I thought the filters were important...
Any thoughts ?
Pete
Naeem
In the last seminar, Iraj mentioned one of the problems with the cycles is that they weren't adaptive to volatility - so in different market conditions they don't adjust.
That was why I thought the filters were important...
Any thoughts ?
Pete
It runs in my system (see attached), but is that how the INDU chart should look ?
Charlton
This indicator highly depends on price. I think that Inverse Fisher Transform is not suitable in this case.
I agree and think that 'adapting to volatility' is important here. A lot of potentialy relevant work in this area is published by Tushar Chande. For example, he explains and provides TS code to produce an Adaptive Stochastic Oscillator which 'adapts' based upon volatility specifically.
I can post it here if you want me to?
Cheers
Steve
I’ve enclosed a pdf of the various oscillators that we could test. Most people know about the Inverse Fisher and standard oscillators like the Cyber Cycle, CG and RVI. I’ve enclosed details of how Ehlers’ latest oscillators work. This is a summary and not an exhaustive technical guide. If you would like to delve deeper into how Ehler designes his oscillators then I recommend you read the following John Ehler books:
Rocket Science for Traders and
Cybernetic Analysis for Stocks and Futures
The oscillators in the pdf summary can be found in Cybernetic Analysis for Stocks and Futures.
Pete,
Take a look at the pdf before reading on.
There are three important components we need to measure if we want to extract the Dominant Cycle (DC) from price within a specific TF:
Frequency of various cycles,
Amplitude of various cycles
Phase within various cycles.
From my understanding, the Adaptive Oscillators designed by Ehler factor in potential changes in price volatility because the measurement of the varying amplitudes of market cycles is a core component when measuring the DC. When we test this particular oscillator we will need to bear in mind that there will be no Macci +100 -100 OB/OS thresholds to work from anymore.
The obvious question then becomes; if the Adaptive Oscillator is adapting to the DC within each TF and we don’t have OB/OS conditions as a barometer how will we measure the convergence of all DC’s within each TF equivalent to the Macci’s +100 -100 OB/OS thresholds? In order to stay consist with MLT a possible suggestion could be to measure the time difference between the trigger signals within each TF.
Buy Signal Example (Reverse for Sell Signals):
1min = Trigger @15:00pm GMT
3min = Trigger @15:05pm GMT
5min = Trigger @15:07pm GMT
The smaller the time difference between each Buy trigger signal within each TF the higher the probability that two conditions are true:
A) All lower TF DC's have converged and are in OS conditions
B) All lower TF DC's are turning within the OS conditions
We will obviously need to find the optimal Allowable Time Difference between trigger signals in all TF’s if we are to pursue this method. That doesn’t sound easy.
Charlton & A_B,
An oscillator calculated using the Inverse Fisher Transform (IF) should not look like the jpeg posted. I think A_B could be right about the Cyber Cycle version of the IF applied to INDU. The IF RSI works fine on the INDU charts so that could be a possible indicator to test. I've enclosed the ELA for that below.
Steve that would be great.
Cheers
Naeem
Hi Pete
I agree and think that 'adapting to volatility' is important here. A lot of potentialy relevant work in this area is published by Tushar Chande. For example, he explains and provides TS code to produce an Adaptive Stochastic Oscillator which 'adapts' based upon volatility specifically.
I can post it here if you want me to?
Cheers
Steve
I have been using Inverse Fisher for a few years and I find that Inverse Fisher signals are more reliable than MACCI in terms of getting the direction right. However MACCI OB/OS seems to capture the exact reversal points. So I use both of them in different TF to capture the move. For example, I use 10min IF to determine the direction and then use MACCI at lower TF to determine entry.
Say 10min IF is entering OB zone or at OB level, then I use 1min MACCI OB to enter the reversal short. This method often captures the exact reversal points.
Or 10min IF crosses down Signal line then enter the short trade with 1min MACCI OB or turning down from highzone. This method offers better directional trades but the entry price is often retested before going further in the direcion of the trade.
So to me the question is
1. Are we after the exact reversal points? or
2. Are we after a better directional trade? or
3. we want both.. lol...