Cci

darrenf

Well-known member
Messages
481
Likes
3
Having browsed these boards quite extensively for the last few weeks now, it seems that the use of CCI as an indicator is very popular.

The only software I have it one is sharescope end of day. The only setting it allows is to enter the number of periods. I have noticed whatever figure you enter, CCI crosses zero at the same time that the price passes through the same period SMA. Sensible really as CCI is based on maoving averages if I have read correctly.

However, I am sure there must be much more to it than this as so many people commend the use of it, but are generally not keen on the use of moving averages?

I would appreciate any comments from traders experienced in the use of CCI and how you actually use it. Also, are there any web based charts that I can apply this to (for say DOW,S&P500 and FTSE100). Not necessarily live charts, but just something I can set it up on to see how it works generally?
 
Briefly, there a 3 uses.
1. when crossing zero as a safe entry.
2. when crossing from above +100 down through, a short entry and crossing from below up through -100 a long entry.
3. Indication of positive and negative divergences.
Other indications are TA formation detection ( bull triangle etc.) and R/S S/R switches.
Like all TA indicators, it requires skill and experience to interpret them correctly and to your advantage.
 
A question for CCI users:

I have just started using CCI and find it very good. At present however I am not using another lower indicator to confirm the signal but applying use of Bollinger Band range and simple trendline from price pivots.

However the many chartists make use of a 3 or 4 system where other indicators are you as a confirming position so that the signal is treated as stronger and less likely to provide a false signal on a 'whipsaw'.

For example combining RSI 2 settings say 14 and 21 together with either or both the slow or fast stochastics restricts false entries on the faster indicator.

I have recently compared RSI to CCI and found that while CCI provided a quicker signal SOMETIMES at others they were the same the difference from the RSI was that it tended to plot in an easier formation for applying a trendline to the indicator while the CCI was a little more 'up and down' breaking its on trendline with a false signal.

Anyway in your opinions if you were to use anther tool alongside CCI which if any do you find best suited to this task.

Regards Kevin
 
kevin546 said:
if you were to use anther tool alongside CCI which if any do you find best suited to this task.
Hi Kevin

I would use Slow Stochastic.

The ultimate question is Why?

It seems to me that your trying to cut out the false signals, in which case you'll be cutting out a lot of signals - both good and bad ones. Adding indicators won't necessary be the best thing to do.

Just my thoughts - and they're worth exactly what you paid for them :cool:
 
FTSE Beater

Thanks for the reply

what chart time do you find most appropriate for your CCI.

Before I started using this indicator I would work from a 5 minute chart but I am not sure about this I have been testing 1,2 & 3 minute charts. I am concerned that the shorter time chart will get you into deals that often may not lead to much, I prefer to get onto intraday trends for 10 - 20 points anything more is a bonus.

regards Kevin
 
Hello CCI users,

I've been keeping an eye ;) on a 14 on 1min. Ftse Future. What are the simpler signals to look for? I think I saw something about a cross thru 100 level.
Any ideas appreciated.

Be lucky,
 
Hi Oatman,

I am new to using CCI but have been charting for over 2 years. If you want a simplistic answer you should be on alert when the indicator moves to an extreme position. That does not in itself mean this is an entry point. It depends what your trading strategy is. Personally I am beginning to see that if you are using fast charts such as 1,2 or 3 minutes then the 34 EMA is very good at producing a very visual signal as to the direction you should trade in. So you may not wish to trade an extreme CCI position if it is against this indicator. If you are scalping and looking for small points then it maybe.

Generally speaking I find Divergence signals to be very good and also a break in the CCI trend which tends to be best when the CCI trend has covered the length of the indicator chart from one extreme to another. There are the shorter trend breaks where in a fall a break down from the zero or 100 line will be seen when a fall continues and the opposite in a rise (bounce off the zero or from a position above 0).

There is some really good stuff on CCI at www.talkstox.com/forum look up articles by Fitzy40 and Woodies and thre are others worth a read. They show examples from there own charts which will point you in the right direction.

regards Kevin
 
Thanks Kevin,

Is this on a 14 period CCI? 14 seems to be the recommended number. I wouldn't know the significance though. Presume it's been tested.

Good luck,
 
Hi Oatman

I don't really know the significance of the figure 14 but yes people do seem to use this setting and a number of other indicators are set at this level by many traders such as RSI and Stochastics for example. I have settled for this setting and it seems fine. However with most decent charting packages you can set more tan one selection often with one CCI reading in a line format and the other in a bar formation so if you wanted to judge a faster setting this is how many do it and often use signals such as 'hooks' as one reading is hooked by the other which is seen when there is an extreme position plotted normally.

I am not an expert on this and do recommend you look up this subject within this and the site I mentioned previously.

regards Kevin
 
I would suggest using a stochastic with the CCI if you are new to the CCI. It may help you understand when to enter the trade a little better. The main thing is to draw trendlines from the two highest or two lowest peaks or troughs. Sometimes traders tend to try to "find" small peaks or troughs where they can draw a steeper trendline to possibly get in early. This may work at times, but will whipsaw you on a choppy day. So be patient, draw a nice looking trendline, wait for it to break, meaning wait for the bar to close through the trendline, enter the trade. This is the conservative way to go for a beginner. The CCI isn't the holy grail. Some might disagree with me, but I suggest you don't blindly follow the + or - 100 cross rules or trade + or - 200 extreme trades. Once you're making consistent profits with the CCI, and you see similar patters in the CCI, and you understand how the CCI reacts to price, then you can start playing those extreme trades and divergences, which you will get a feel for, and understand which ones work and which don't.
 
If you want to improve on the CCI trendline breaks then the way to do this is to watch the price bar pivots very closely and then locate the price pivot on the CCI line. In most cases the price pivot will appear on the CCI line at the appropriate point, however there are times when the price pivot is no

t always in line with the pivot on the CCI line. By plotting the price pivot on the CCI and then applying a trend break approach you will be keeping right up with the price trend line at all times.

This is particularly the case when at the end of a price move the CCI often moves up or down against the existing movement only to complete the last move up or down in the prevailing trend before a reversal. When this movement takes place it can often form a new pivot slightly out with the price trendline and often an earlier signal can be generated by looking at the first part of the recent trend and line up the trendline with the last price pivot point which may mean crossing through an earlier part of the CCI rather than just creating a line along the tops of the CCI in a down trend for example.

regards Kevin
 
"Anyway in your opinions if you were to use anther tool alongside CCI which if any do you find best suited to this task."

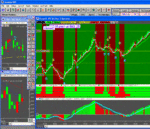
A 2 ma crossover system is very useful: I use a modified version of


http://www.tedtick.com/downloads/chartpoint1.pdf combined with MACD

I read it (it's all about using a Hammond indicator based on a 3MA of
(HI+LO+CL)/3 ) but trying it out found it by itself was not of much use: it
was far too sensitive. However the ideas it gave me have lead to a new
system which appears to work very well in ES..

Basically I draw 2 lines:
a Simple 3MA based on (HI+LO+CL)/3 (a standard facility in IRT MAs) BLUE
line Called PLdot
and a 3 simple MA of the above -RED line.

These act as a very simple MACD indicator drawn on the chart itself.
I paint the candles on the chart based on the formula (CL-PLdot) +ve green
and -ve red. This keeps you in trends until they reverse. NOTE this is very
important allows you to trade what you see...


The basic idea is PLdot forms a trend line: if the Close is above it we
should be long, below it we should be short.
Confirmation is when the Blue line is above Red and vice versa.

You can call tops by the shape of the BLUE line: it forms a very noticeable
rounded line.
 

Attachments

  • pldot.gif
    pldot.gif
    212.7 KB · Views: 517
T249 said:
The CCI isn't the holy grail.


Hi T249,


I agree totally.


PS - Is this the same T249 ex TBS?

If so good to see you about again! And I hope the exams went well.

Come and see us over on Eurostoxx too :)
 
Top