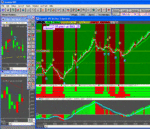
Having browsed these boards quite extensively for the last few weeks now, it seems that the use of CCI as an indicator is very popular.
The only software I have it one is sharescope end of day. The only setting it allows is to enter the number of periods. I have noticed whatever figure you enter, CCI crosses zero at the same time that the price passes through the same period SMA. Sensible really as CCI is based on maoving averages if I have read correctly.
However, I am sure there must be much more to it than this as so many people commend the use of it, but are generally not keen on the use of moving averages?
I would appreciate any comments from traders experienced in the use of CCI and how you actually use it. Also, are there any web based charts that I can apply this to (for say DOW,S&P500 and FTSE100). Not necessarily live charts, but just something I can set it up on to see how it works generally?

